Rules First Swing Trading Strategy You Can Validate in 30–50 Trades
A practical swing trading strategy is a rules-based setup paired with strict risk control: risk no more than 1 to 2% of your account per trade, and only take trades with a favorable reward-to-risk ratio (generally at least 1:2). Trades typically run several days to a few weeks. Pick one setup, like a pullback-to-trend, and paper-trade it 30 to 50 times before risking real money.
TL;DR:
- Implement risk no more than 1 to 2% of your account on each trade, based on your entry and stop-loss, to survive inevitable losing streaks.
- Use a confluence of setups like pullback-to-trend, support bounce, or volume-confirmed breakouts, combined with reward-to-risk ratios of at least 1:2.
- Apply a three-timeframe analysis using daily, 4-hour, and 1-hour charts to confirm trend, support, and timing for entries.
- Paper-trade at least 30 to 50 trades to validate strategies and avoid overconfidence, adjusting size based on actual results.
- Follow disciplined rules such as pre-writing trade plans, avoiding revenge and overtrading, and setting hard stops to protect against emotional decisions.
Table of Contents
- What Is Swing Trading and How Does It Differ From Day Trading?
- Which Swing Trading Setups Actually Work?
- How Much Should You Risk on Each Swing Trade?
- What Chart Timeframes and Tools Do You Actually Need?
- Three Example Trades You Can Copy Into a Journal Today
- How Do You Build a Trade Plan and Journal That Actually Improves Your Results?
- Why Do So Many Swing Traders Sabotage Their Own Edge?
- Why Rules Beat Instinct in Swing Trading
- Ready to Put a Swing Trading System Into Practice?
- Sources
- FAQ
What Is Swing Trading and How Does It Differ From Day Trading?
Swing trading means holding a position anywhere from a few days to a few weeks, aiming to capture one meaningful leg of a price move rather than the whole trend. Schwab’s own education material frames it as capturing the “middle” of a move, not the exact top or bottom, which takes pressure off timing entries perfectly.
That holding period changes everything about how you trade. Day traders close everything before the closing bell and often need $25,000 in their account to avoid the Pattern Day Trader rule. Swing traders sidestep that requirement in most cases, since they’re not making four or more day trades within five business days in a margin account, according to BrokerChampion’s comparison of the two styles.
The trade-off is overnight and weekend gap risk. A stock can open 8% lower on an earnings surprise or a geopolitical headline, and your stop loss does nothing while the market is closed. Here’s how the two styles stack up on the factors that actually matter for a beginner deciding which one fits their life:
- Time commitment: Day trading demands hours of screen-watching daily; swing trading needs 30 to 60 minutes for planning and a few check-ins.
- Capital requirements: Day trading often needs $25,000 for pattern-day-trader compliance; swing trading has no such federal minimum.
- Trade frequency: Day traders take multiple trades daily; swing traders might take two to five trades a week.
- Primary risk: Day traders face intraday volatility; swing traders face overnight and weekend gaps.
- Reward profile: Swing trades tend to produce larger per-trade gains since they capture bigger price swings.
If you’re weighing swing vs day trading for the first time, the honest answer to “which is better” depends on your schedule more than your skill. Read more on how swing trading and day trading compare for your specific life if you’re still deciding which fits.
Which Swing Trading Setups Actually Work?
Six setups show up again and again in TradingSim’s breakdown of strategies that hold up over time, and each one earns its place for a different market condition. None of them work in isolation. High-probability trades require confluence: price action lining up with an indicator, confirmed by volume, with a reward-to-risk ratio of at least 1:2, according to Ticker Daily’s swing trading guide.
-
Pullback-to-trend. Confirm the stock is in an established uptrend using the 50-day moving average sloping upward. Wait for price to pull back to the 20 or 50 EMA without breaking it on a closing basis. Your trigger is a bullish reversal candle or a break above the pullback’s short-term high. Place your stop just below the swing low of the pullback. Target the prior high, or a measured move equal to the initial trend leg.
-
Support/resistance bounce. Identify a level tested at least twice with clear reaction. Wait for a bounce confirmed by a bullish candle pattern (hammer, engulfing bar) or a spike in volume. The stop goes below the support level itself, not below some arbitrary percentage. Target the next resistance zone up, and only take the trade if that distance gives you 1:2 or better.
-
Breakout. Look for a stock consolidating in a tight range, then breaking out on volume at least 1.5 times its 20-day average. False breakouts are common, so wait for a close above the level, not just an intraday poke through it. Place your stop back inside the range, below the breakout candle’s low. Target a distance equal to the height of the prior consolidation range.
-
Moving-average cross with confluence. A 10/20 EMA cross alone produces too many false signals to trade on its own. Combine it with the stock trading above its 50 and 200 day moving averages, and ideally with rising volume on the crossover day. Stop below the most recent swing low. Target the next major resistance or a fixed multiple of your risk.
-
VWAP and Fibonacci retracement. VWAP anchored to a significant swing low or earnings date acts as a magnet for price and a logical stop reference on pullbacks. Fibonacci retracements, especially the 50% and 61.8% levels, work best when they line up with a prior support zone or moving average rather than standing alone. Both are situational tools, not standalone systems, and both fall apart in choppy, low-volume conditions.
-
Earnings momentum. This is the highest-risk, highest-reward setup on the list. A stock gaps up on strong earnings, pulls back for a day or two as early buyers take profit, then resumes higher on the “second leg.” The entry trigger is a reclaim of the gap-day’s low with volume; the stop sits below that low, since a failed reclaim usually means the move is over.
Pro Tip: Screen for liquid stocks and ETFs with tight bid-ask spreads before you ever look at a chart pattern. A textbook setup on an illiquid ticker still slips on entry and exit, which quietly erodes your edge before the trade even starts, a point Fidelity’s swing trading education makes explicitly.
How Much Should You Risk on Each Swing Trade?
The 2% rule caps how much of your account you’re willing to lose on a single trade, and it’s the single most important number in this entire strategy. Risk 1 to 2% of your total account per position, calculated from your entry to your stop loss, not from your entry to some hoped-for target. TradingSim’s comparison of day and swing trading points to this cap as the deciding factor in whether traders survive a losing streak or blow up their account.
Here’s the math in practice. Say you have a $10,000 account and you’re risking 1% per trade, which is $100. You find a pullback setup on a stock trading at $50, with your stop placed at $48. That’s a $2 per-share risk. Divide your dollar risk by your per-share risk: $100 divided by $2 equals 50 shares. That’s your entire position size, calculated backward from risk, not forward from how much you “want” to buy.
Stops belong at technical invalidation points, below a support level, below a moving average, below the low of a breakout candle, never at a round percentage picked out of thin air. Fidelity’s own trading education recommends measuring trade performance against the width of the trading channel itself, which forces you to think in terms of what the chart is actually telling you rather than an arbitrary number.
A few rules keep this system intact over dozens of trades:
- Never take a trade where the stop distance forces a position size larger than your risk cap allows.
- Only enter trades offering 1:2 reward-to-risk or better, measured from entry to stop and entry to target.
- Reduce size or skip trades entirely around earnings if you’re not intentionally running an earnings-momentum setup.
- Keep enough margin cushion that a single overnight gap doesn’t trigger a forced liquidation.
That math is what makes disciplined losses survivable. For a deeper walkthrough of stop placement and sizing, Profitomics has a full breakdown of risk management rules worth bookmarking.
What Chart Timeframes and Tools Do You Actually Need?
A three-timeframe routine keeps you from mistaking noise for a trend. Start on the daily chart to establish context: is the stock above or below its 50 and 200 day moving averages, and is that trend actually intact? Investopedia’s overview of swing trading confirms multi-timeframe analysis, daily context down to 4-hour and 1-hour execution, is standard practice among swing traders rather than an optional extra.
Once the daily chart flags a candidate, drop to the 4-hour chart to confirm the setup itself: is the pullback shallow enough, is the support zone holding, is volume behaving the way it should. The 1-hour chart is purely for timing the entry trigger and tightening your stop, not for making the trade decision in the first place.
Your toolset doesn’t need to be complicated:
- EMA/SMA (20, 50, 200): trend direction and pullback reference points.
- RSI: spotting overbought or oversold conditions that support a reversal thesis.
- MACD: momentum confirmation on crossovers.
- Volume: validating breakouts and rejecting weak moves.
- VWAP: intraday and swing-level price anchors, especially post-earnings.
Three Example Trades You Can Copy Into a Journal Today
Here are three complete blueprints, worked through with real position-size math, that you can paper-trade immediately.
-
Pullback-to-trend long. Stock XYZ trades at $80, in a clear uptrend above its rising 50-day MA. It pulls back to $76, holds the 50 EMA, and prints a bullish engulfing candle. Entry: $77 on the breakout of that candle’s high. Stop: $74.50, below the pullback’s swing low, a $2.50 risk per share. Target: $82.50, the prior high, giving roughly 1:2.2 reward-to-risk. On a $20,000 account risking 1% ($200), that’s $200 divided by $2.50, or 80 shares.
-
Breakout with volume confirmation. Stock ABC consolidates between $30 and $32 for three weeks. It breaks above $32 on volume double its 20-day average and closes at $32.60. Entry: $32.70 the next morning on continuation. Stop: $31.40, back inside the old range, a $1.30 risk per share. Target: $35.70, matching the $2 range height projected upward. On the same $200 risk budget, that’s about 153 shares, scaled down if liquidity or spread makes that size impractical.
-
Earnings momentum swing. Stock DEF gaps from $40 to $46 on strong earnings, then drifts down to $44 over two sessions as early buyers take profit. Entry: $46.10, on a reclaim of the earnings-day low with rising volume. Stop: $43.80, below that gap-day low, a $2.30 risk per share. Target: $50.70, a measured move of the initial gap. Risking $200 gives you roughly 86 shares.
Pro Tip: Paste these three fields into every trade before you enter: thesis, stop price, and target price. If you can’t write the stop and target before you click “buy,” you’re not ready to take the trade.
How Do You Build a Trade Plan and Journal That Actually Improves Your Results?
A trade plan template needs five fields filled out before you enter, not after: the thesis (why this setup, why now), entry price, stop price, target price, and position size. Skipping any one of these is how disciplined traders slide back into gut-feel trading within a few weeks.
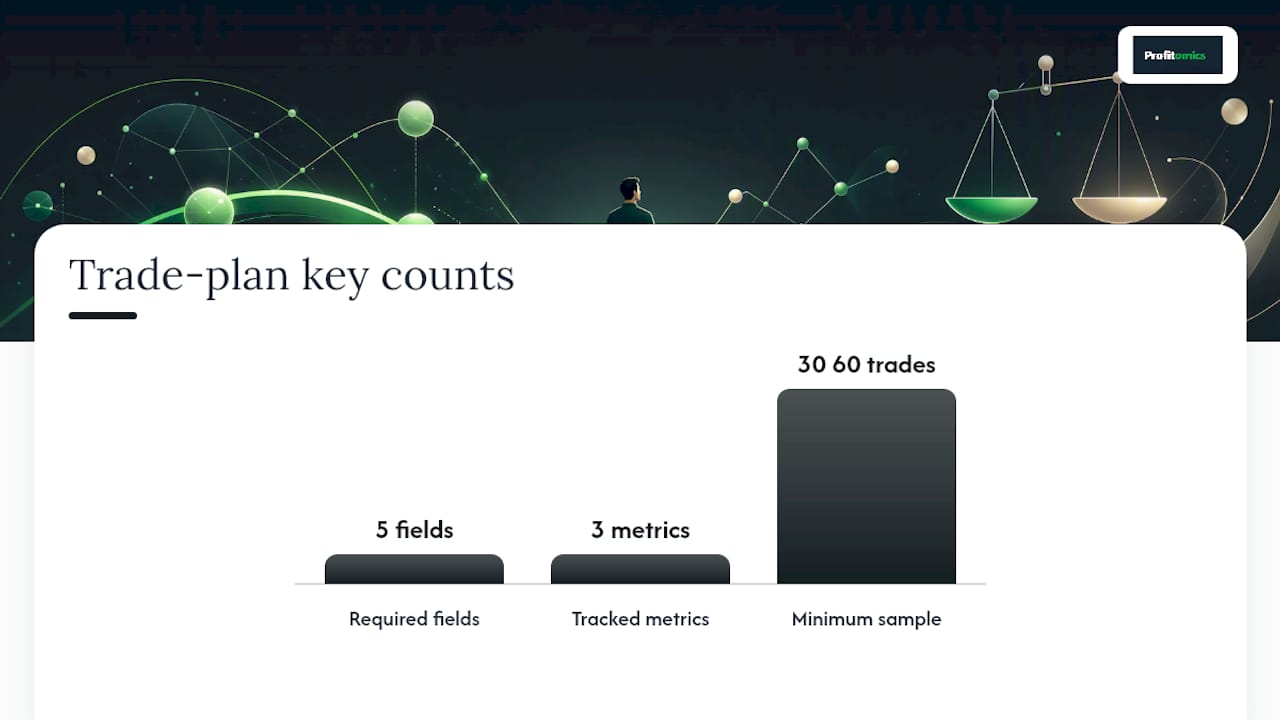
Track win rate, average reward-to-risk realized, and expectancy per trade, which is your win rate multiplied by average win, minus your loss rate multiplied by average loss. That single number tells you whether a setup is actually worth trading or just feels good in the moment.
TradingSim recommends a minimum sample of 30 to 50 trades, paper or live, before you trust a setup enough to increase size. Fewer than that, and you’re reading noise, not a real edge.
- Log every trade the same day it closes, win or lose, no exceptions.
- Review weekly for patterns: are losses clustering around a specific setup or time of day?
- Only increase position size after a validated sample shows consistent expectancy.
- Cut or revise a setup that underperforms across 30-plus trades rather than hoping it turns around.
If you haven’t paper-traded before, Profitomics has a practical start-up plan for paper trading that walks through exactly what to track.
Why Do So Many Swing Traders Sabotage Their Own Edge?
Revenge trading after a loss is the fastest way to turn a manageable drawdown into an account-ending one. The fix is mechanical: a pre-registered list of setups you’re allowed to trade that day, decided before the market opens, and a mandatory cooling-off period after any loss beyond your normal size.
Overtrading and ignoring stops usually come from the same root cause: treating a stop loss as a suggestion instead of a rule. Set hard stops in your broker’s platform rather than mental stops you might talk yourself out of honoring.
Overconfidence after a winning streak is just as dangerous as fear after a losing one. Cut your size back after three or four consecutive wins and re-check whether you’re still following the setup rules or just riding luck.
- Write your trade plan before market open, not during it.
- Do an end-of-day review, even on days you didn’t trade.
- Set price alerts instead of watching charts all day, which invites impulsive entries.
Pro Tip: If you catch yourself sizing up “to make back” a loss, that’s the exact moment to close the platform for the day. Profitomics has a full breakdown of revenge trading patterns worth reading before it costs you real money.
Why Rules Beat Instinct in Swing Trading
Most new traders think the setup is the hard part. It isn’t. The hard part is doing the same boring, unglamorous thing after five losing trades in a row that you did after five winners. Templates and checklists exist for exactly that reason: they remove the moment of hesitation where discipline usually breaks down.
The setups and risk rules in this article map directly onto the kind of checklist that shortens a beginner’s learning curve from years to weeks. Test small, journal everything, and only scale size once the numbers, not your gut, tell you the edge is real.
— Kai
Ready to Put a Swing Trading System Into Practice?
Reading about pullback setups and position sizing is one thing. Having the actual spreadsheet that calculates your share size from your stop distance, and the checklist that stops you from entering a trade without a defined target, is another. Profitomics built the Stock Market Mastery ebook around exactly the workflow covered here: rules-based setups, risk-first position sizing, and copy-paste trade-plan templates instead of vague theory.
The ebook includes the trade-plan template and journaling tracker referenced above, pre-built so you’re not designing a spreadsheet from scratch while trying to learn a new skill at the same time. It also walks through the multi-timeframe scanning routine step by step, with checklists for each of the setups covered in this guide. If you’re ready to stop testing rules in your head and start testing them on paper with a real system, get instant access to Stock Market Mastery and start your first 30-trade validation this week.
This article is general information, not a substitute for advice from a qualified financial advisor. Consult a qualified financial professional about your own circumstances before acting on anything here.
Sources
- What Is Swing Trading and How Does It Work? — Charles Schwab
- Swing trading setups — Fidelity Learning Center
- 7 Swing Trading Strategies That Actually Work (2026) — TradingSim
- How to Swing Trade: A Strategy Guide for 2026 — Ticker Daily
FAQ
What strategy is best for swing trading?
No single setup wins every market, but pullback-to-trend and breakout-with-volume trades are the most consistently cited as reliable starting points because they rely on price action confirmed by volume rather than a single indicator alone.
Is swing trading really profitable?
Swing trading can be profitable when it’s run with strict risk-reward thresholds of 1:2 or better and validated over a real sample of 30 to 50 trades, but it carries genuine risk, including overnight gaps, and isn’t guaranteed income for anyone.