Risk Management Trading Rules Every Trader Needs

Cap every trade at 1% to 2% of account equity, place your stop where your trade thesis breaks (not at a round number), and stop trading for the day once losses hit 3%. That is the entire foundation. Everything else in trading, from strategy to psychology, only compounds if this layer holds first.
Before you take another trade, run this three-step check:
- Pick a risk percent per trade (1% for most accounts, 2% as a hard ceiling) and write it down somewhere you can’t ignore it.
- Calculate position size from that percent and your stop distance, not from a gut feeling about how many shares “feels right.”
- Set the stop order the moment you enter, tied to where your trade idea is actually wrong.
Pro Tip: Write your risk percent on a sticky note on your monitor. The rule only works if you see it before every single order ticket.
Key Takeaways
| Point | Details |
|---|---|
| Cap risk per trade | Risk 1% of account equity per trade, treating 2% as an upper ceiling, never a target. |
| Set a daily loss limit | Stop trading for the day once losses reach 3% of account equity, no exceptions. |
| Size positions with math | Use position size = (equity × risk %) ÷ dollar stop distance for every trade. |
| Manage portfolio heat | Cap total at-risk equity across all open positions around 6% to control correlation risk. |
| Use ready-made templates | Profitomics’s Stock Market Mastery and Crypto Profit System build these calculators and checklists into ready-to-use spreadsheets. |
Table of Contents
- What Does Risk Mean in Trading?
- What Types of Risk Do Traders Face?
- Why Does Risk Management Matter More Than Strategy?
- What Are the Core Risk Management Rules for Trading?
- How Do You Calculate Position Size for a Trade?
- What Is the 2% Rule and When Should You Use It?
- How Do You Manage Risk Across a Whole Portfolio?
- How Does Leverage Change Your Risk Calculation?
- How Should You Handle a Trade That Goes Wrong?
- What Templates Help You Apply These Rules Consistently?
- Why These Rules Actually Hold Up in Real Trading
- Put These Rules Into a System You’ll Actually Use
- Sources
- FAQ
What Does Risk Mean in Trading?
Risk isn’t the price moving against you. It’s the dollar amount you actually lose once your stop fills, plus whatever slippage and gap risk tack onto that number. If you buy a stock at $50 with a stop at $48 and you’re holding 100 shares, your planned risk is $200, not the $5,000 you put into the position.
Three tools translate that abstract danger into numbers you can act on:
- Average True Range (ATR) measures how much a security typically moves in a day, which tells you whether a $2 stop is tight or reckless for that particular stock.
- Maximum drawdown tracks the worst peak-to-trough decline in your account, a number that matters more than any single win or loss.
- Value at Risk (VaR) estimates the likely worst-case loss over a set period at a given confidence level, more common in institutional risk desks but useful conceptually for retail traders sizing a portfolio.
Stops are a plan, not a guarantee. A gap through your stop level or a burst of thin liquidity can fill you well past where you intended to exit, which is exactly why sizing for the worst case matters more than sizing for the average case.
What Types of Risk Do Traders Face?
Not every risk gets solved by a stop-loss order. Some require entirely different controls.
- Market risk (broad price movement against your position): mitigated by stop placement and position sizing.
- Liquidity risk (can’t exit at a fair price): mitigated by trading smaller size or staggering entries and exits in thin names.
- Execution and slippage risk (fills worse than expected): mitigated by using limit orders where possible and avoiding illiquid pre/post market windows.
- Correlation risk (multiple “different” positions moving together): mitigated by capping total exposure per sector or theme.
- Tail and gap risk (overnight news, earnings surprises): mitigated by reducing size before known catalysts or hedging with options.
Stops handle market risk well. Correlation and tail risk need portfolio-level rules, not just tighter stops.
Why Does Risk Management Matter More Than Strategy?
A trader with a 60% win rate and no risk control can still blow up. Here’s the math: if you risk 20% of your account on a single trade and lose, you need a 25% gain just to get back to even. Risk 50% and lose, and you need a 100% gain. That asymmetry is the entire reason position sizing sits above strategy in importance.
Compare two traders risking 1% versus 10% per trade with identical win rates.
- One bad month at 10% risk per trade can undo two years of steady 1% compounding.
- Research on retail trading outcomes consistently finds that roughly 70% to 80% of retail traders lose money over meaningful stretches, and the missing ingredient is usually process, not a lack of a profitable edge.
No strategy, however sharp, survives contact with undisciplined sizing.
What Are the Core Risk Management Rules for Trading?
Here’s the rule set worth printing out and taping to your monitor.
- Per-trade risk: 1% of account equity is the working standard; treat 2% as the absolute ceiling, never the target.
- Daily loss limit: stop trading for the day once you’re down 3% of equity, no exceptions, no “one more trade to get it back.”
- Drawdown tiers: at 10% drawdown, cut position size in half; at 15% to 20%, stop live trading entirely and go back to a demo account until you find what broke.
- Stop placement: set stops where your trade thesis is proven wrong (a broken support level, a failed breakout, a violated trend line), never at a fixed dollar or percentage distance chosen for comfort.
- Never widen a stop to “give it room.” A stop moved further away isn’t risk management, it’s hope wearing a risk-management costume.
Here’s how those rules play out on a $50,000 account. If your setup requires a stop $2 away from your entry, you can buy 250 shares. If the same setup needs a $5 stop because the stock is more volatile, you can only buy 100 shares. The rule adjusts your size automatically. It never asks you to guess.
Pro Tip: Automate what you can. A rule you have to remember to enforce is a rule you’ll eventually skip.
How Do You Calculate Position Size for a Trade?
The formula behind every rule above is simple:
Position size = (Account equity × risk %) ÷ (dollar distance to stop)
That’s it. No advanced math, no proprietary indicator, just arithmetic you can run in your head or a spreadsheet.
You want to buy a stock at $60 with a stop at $57, a $3 distance. Divide $300 by $3 and you get 100 shares.
Your stop is 10 ticks away, and each tick is worth $12.50 on that contract, making your dollar risk per contract $125. Divide $500 by $125 and you can trade 4 contracts.
Build this into a spreadsheet once and reuse it for every single trade. The math doesn’t change; only the inputs do.
What Is the 2% Rule and When Should You Use It?
Most professional risk frameworks start with the 2% Rule, which CME Group formalizes with worked examples showing how account size, contract count, and tick distance interact under a hard 2% ceiling.
The 2% Rule states that a trader should never risk more than 2% of total account equity on a single trade, a constraint designed to keep any one loss from meaningfully damaging the account’s ability to recover.[2% Rule]
The Kelly criterion gets cited constantly in trading forums, and it has real mathematical appeal: it calculates the theoretically optimal bet size given your win rate and payoff ratio. The catch is that Kelly’s raw output often suggests risking far more per trade than any sane retail trader should touch, since it assumes you know your edge with precision most traders don’t actually have. Most practitioners who use Kelly at all run it at a quarter or half of the full calculated size.
- Day traders often require tighter risk:reward minimums (1.5:1) because trade frequency is high.
- Swing and position traders should generally demand 2:1 or better, since fewer trades mean each one needs more room to justify the risk.
How Do You Manage Risk Across a Whole Portfolio?
Individual trade risk means nothing if five “different” positions all move together. That leaves room for a string of simultaneous stop-outs without a catastrophic single-day loss.
Correlation is where this breaks down fastest. Three tech stocks that all rally and fall together aren’t three separate risks; they’re one concentrated bet wearing three different tickers.
- Set a hard portfolio heat cap (6% is a reasonable conservative target).
- Limit exposure per sector or theme, not just per individual position.
- Use options or inverse positions to hedge concentrated exposure when you can’t reduce it directly.
- Schedule a weekly portfolio review to catch correlation creep before it becomes a problem.
How Does Leverage Change Your Risk Calculation?
Leverage doesn’t just amplify gains, it amplifies every mistake in your sizing math.
Margin calls happen when your account equity drops below the maintenance margin your broker requires, and they can force liquidation at the worst possible moment, often during the exact volatility spike that caused the drop.
- Keep leverage conservative (2:1 or lower for most retail strategies) unless you fully understand the margin mechanics involved.
Pro Tip: Set a margin alert well above the maintenance threshold, not at it. You want a warning while you still have options, not a forced liquidation notice.
How Should You Handle a Trade That Goes Wrong?
Discipline in the moment matters as much as the plan itself.
- Place your stop the instant you enter, before you watch the position move even once.
- Predefine your exit target so you’re not deciding under pressure.
- Size the position correctly using the formula above before you click buy, not after.
When a stop hits, journal it immediately: did you follow the rule set, or did you deviate? That single question matters more than whether the trade made money. A losing trade where every rule was followed is a process success. A winning trade where you ignored your stop is a warning sign dressed up as a good outcome.
Pro Tip: Track “rules followed” as its own metric in your journal, separate from profit and loss.
What Templates Help You Apply These Rules Consistently?
A working system needs four pieces: a position-size calculator, a daily-loss monitor, a trade journal template, and a pre-entry checklist you run through before every order. Build these once in a spreadsheet and every future trade takes seconds to size correctly instead of minutes of guessing.
Before trusting any rule set with real money, backtest it against 50 to 200 historical trades or roughly three to six months of daily data. Look specifically at how often your stop distance matched actual volatility and whether your position sizes stayed inside your risk cap.
Profitomics builds these exact templates into its Stock Market Mastery ebook for equities and its Crypto Profit System for digital assets, both structured around the same math covered above. Test any template on paper or in a demo account first. No spreadsheet replaces the discipline of watching it work before you fund it.
Why These Rules Actually Hold Up in Real Trading
The biggest surprise for most traders isn’t that risk management works. It’s how boring it feels compared to strategy talk, right up until it saves an account during a bad month.
Nothing fancier than that.
Put These Rules Into a System You’ll Actually Use
Having the calculators, checklists, and journal templates already built so you’re not rebuilding a spreadsheet at midnight before a trading day is another. Profitomics’s Stock Market Mastery ebook packages the exact position-sizing formulas, drawdown tiers, and pre-entry checklist covered in this guide into templates you copy and use immediately, and the Crypto Profit System adapts the same risk-first math for the higher volatility that crypto trading demands.

If you’re unsure what starting risk percent fits your temperament, a resource like TESTUNO’s risk personality assessment can help you land on a conservative starting point before you touch a live account. Whichever path you choose, backtest the templates against your own trading history or a demo account before deploying real capital. Head to Profitomics to download the templates and start building your rule set today.
Sources
For deeper detail on the frameworks covered here, read CME Group’s original explanation of the 2% Rule, TradeZella’s layered risk guide, and Investopedia’s risk management techniques overview.
- Risk Management Framework for Active Traders - BBA Trading
This article is general information, not a substitute for advice from a qualified financial advisor. Consult a qualified financial professional about your own circumstances before acting on anything here.
FAQ
What Is Risk Management in Trading?
Risk management in trading is the set of rules that controls how much of your account you can lose on any single trade, day, or drawdown period, covering position sizing, stop placement, and portfolio-level exposure limits.
What Is the 2% Rule in Trading?
The 2% Rule caps risk on any single trade at 2% of total account equity, a limit CME Group frames as protecting the account’s ability to recover from a losing streak.
What Is the Best Risk Management Strategy for Trading?
What Are the Five Risk Management Strategies?
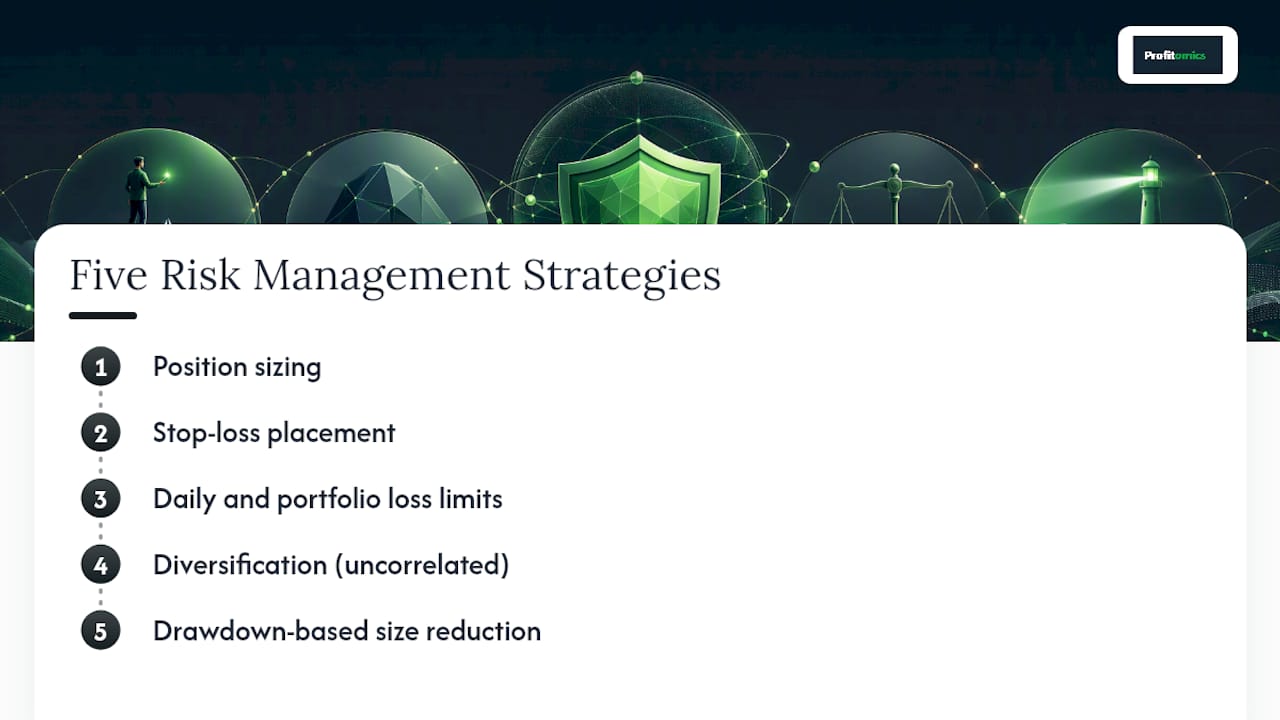
Common categories include position sizing, stop-loss placement, daily and portfolio loss limits, diversification across uncorrelated positions, and drawdown-based size reduction, each targeting a different type of trading risk.