Trend Following Strategy: A Rules-First Playbook

A trend following strategy is a rules-based system that enters trades after a price trend is already established and exits when that trend reverses. No forecasting, no opinions. If you can follow a checklist and sit through losing streaks without abandoning the system, this approach is worth your time. If you need to be right most of the time to stay motivated, it probably isn’t.
Every functional trend-following system shares four core elements:
- Market filter: Determines whether a market is trending at all (e.g., price above the 200-day moving average)
- Entry trigger: The specific signal that opens a position (e.g., a 20-day breakout or MA crossover)
- Stop loss: The price level that closes a losing trade and caps the damage
- Position sizing: The formula that decides how many units to buy or sell based on account risk and volatility
Get those four right and you have a system. Skip any one of them and you have a guess.
Key Takeaways
A trend following strategy works because it accepts many small losses in exchange for occasional large wins, and the math is positive only when position sizing is disciplined enough to survive the losing stretches.
| Point | Details |
|---|---|
| Four-component structure | Every system needs a market filter, entry trigger, stop loss, and position-sizing rule before you trade. |
| 1% risk per trade | Size each position so the distance from entry to stop equals 1% of account equity, adjusted by ATR. |
| Win rate below 45% is normal | Trend systems lose more often than they win; profit comes from average winners being several times larger than average losers. |
| Walk-forward testing required | Backtest on 70–80% of data, then validate on the remaining 20–30% without changing parameters. |
| Profitomics templates | The Stock Market Mastery ebook includes position-sizing calculators and trade-tracking spreadsheets for immediate use. |
Table of Contents
- How does a trend following strategy actually work?
- Core principles every trend follower has to internalize
- Which indicators and techniques do trend followers actually use?
- What historical examples prove trend following works?
- Trend following vs. momentum: what’s the actual difference?
- How to build and backtest a simple trend-following strategy
- A practical template you can paper trade today
- Which markets and timeframes suit trend following best?
- What are the real risks of trend following?
- Why trend following suits beginners who want rules, not predictions
- Profitomics gives you the templates so you can skip the spreadsheet build
- Sources
How does a trend following strategy actually work?
The operational loop is simple: filter the market, trigger the entry, size the position, set the stop, trail the stop as the trade moves in your favor, and exit when the trend breaks. That cycle repeats across every trade, every market, every timeframe.
Trend following is formally defined as buying an asset when its price trend goes up and selling or shorting when the trend goes down. Practitioners use moving averages, channel breakouts, and price-based rules rather than fundamental forecasts. The key word is rules. Nothing is discretionary.
Entry types and why late entry is acceptable. Most trend followers enter after the trend has already started. A breakout above a 20-day high is not a prediction that the price will rise; it is confirmation that it already has. That late entry costs some profit at the start of every move, but it also means you are not guessing at reversals. MA crossovers work the same way: the 50-day crossing above the 200-day tells you momentum has shifted, not that it will shift.
Exit mechanics. A robust trend-following strategy has four components: market filter, entry trigger, stop loss, and profit exit. The stop loss is typically set at a fixed ATR multiple below entry (more on that in the template section). The profit exit is usually a trailing stop, not a fixed target. Trailing stops are what let winners run: as price moves up, the stop moves up with it, locking in gains without capping the upside.
Timeframes and signal frequency. Most retail trend systems run on daily bars. Holding periods range from a few weeks to several months on trending markets. You will not be placing trades every day. On a single liquid instrument, a simple MA crossover system might generate 6–12 signals per year. That low frequency is a feature, not a bug: it keeps transaction costs down and reduces the temptation to tinker.
- Entry: after trend confirmation (breakout or crossover)
- Initial stop: ATR-based, set at entry
- Trailing stop: follows price, never moves backward
- Exit: triggered when price hits the trailing stop or a reversal filter fires
Stat to know: TraderNest’s analysis of practical trend systems targets a profit factor above 1.5 with a win rate of roughly 35–45%. You lose more often than you win. The math works because the wins are much larger than the losses.
Core principles every trend follower has to internalize
Cut losses short, let winners run. This is the oldest rule in trading and the one most people violate. In a trend-following context it is not a slogan; it is the entire business model. Small, frequent losses are the cost of admission. The occasional large winner pays for all of them and then some.

Combined with ATR-based stops, this produces a position size that automatically shrinks when volatility is high and grows when volatility is low. The formula is: Position size = (Account equity × Risk %) ÷ (ATR × Stop multiple). That math keeps any single loss from being catastrophic.
Diversification across uncorrelated markets. A single-market trend system will have brutal drawdown periods when that market chops sideways. Spreading across commodities, currencies, bonds, and equities smooths the equity curve because not all markets chop at the same time. Winton’s institutional research frames this precisely: trend following is a systematic strategy that benefits from exposure to many markets and can go long or short, giving it access to price trends wherever they appear.
Mechanical execution, no overrides. The moment you start skipping signals because “this one feels different,” you have broken the system. Backtests are only valid if you execute every signal the rules generate. Discretionary overrides introduce a bias that the backtest never measured.
- Risk 1% or less per trade
- Size positions using ATR, not dollar amounts or gut feel
- Trade at least 5–10 uncorrelated markets when possible
- Execute every signal the rules generate, without exception
Pro Tip: *The traders who survive long drawdowns are the ones who sized small enough that the drawdown never threatened their ability to keep trading.
Which indicators and techniques do trend followers actually use?
The good news: you do not need a complex indicator stack. QuantInsti warns explicitly against overfitting indicator stacks and recommends simple, well-understood filters combined with rigorous walk-forward validation. Here are the methods that show up most consistently in practitioner literature.
Moving average crossovers (50/200-day). The 50-day MA crossing above the 200-day (the “golden cross”) is the most widely cited trend filter. It is slow, which means fewer signals and more whipsaws in choppy markets, but it keeps you on the right side of major multi-month trends. Best suited for equities and large-cap indices where trends develop over months.
Donchian channel breakouts (20/10-day). Buy when price breaks above the 20-day high; exit when price drops below the 10-day low. This is the core of the Turtle system. It generates more signals than the MA crossover and catches trends earlier, but it also produces more false breakouts in range-bound markets.
ATR-channel breakouts. Entry when price moves a set ATR multiple beyond a recent range. The ATR component adapts the breakout threshold to current volatility, so the signal is relatively consistent across different market conditions. Useful for futures and forex where volatility shifts significantly.
Price vs. 200-day MA filter. A simple binary: only take long signals when price is above the 200-day MA; only take short signals when below. This filter alone eliminates a large portion of countertrend whipsaws without requiring a second indicator.
Stop placement. Common practice uses 2–3x ATR below the entry price as the initial stop. Swing-low stops (placing the stop just below the most recent significant low) are an alternative for traders who prefer structure-based exits.
Combining filter and entry. A practical combo: use price above the 200-day MA as the filter, then enter on a 20-day high breakout. This keeps you out of downtrending markets while still catching early breakouts in uptrending ones. The filter does the heavy lifting; the entry trigger just tells you when.
Key figure: The First Time Investor’s guide notes that ATR-based stops set at 2x ATR are a standard starting point for volatility-adjusted exits, giving the trade enough room to breathe without letting a loss grow uncontrolled.
What historical examples prove trend following works?
The Turtle experiment is the most cited proof of concept in trend-following history. In the early 1980s, Richard Dennis and William Eckhardt recruited a group of novice traders, taught them a mechanical breakout system, and sent them to trade. The rules were straightforward: enter on Donchian breakouts, size positions using volatility, pyramid into winning trades, and diversify across many futures markets. Michael Covel’s archived documentation of the Turtle system confirms that simple, mechanical breakout rules combined with volatility sizing and diversification produced meaningful long-term returns. The lesson was not that the specific parameters were magic. It was that the structure worked: breakout entry, ATR sizing, multiple markets, strict stops.
At the institutional level, Winton Group is one of the most studied examples of systematic trend following applied at scale. Winton’s own research describes trend following as a strategy that seeks to profit from price trends across stocks, bonds, commodities, and currencies by applying rules-based systems and diversification. Winton emphasizes that the strategy’s value includes access to “novel exposures” in commodities, FX, and rates that are difficult to replicate in a long-only stock portfolio. The strategy is explicitly non-predictive: it does not forecast where prices will go; it reacts to where they have gone.
Crisis alpha: Trend following has historically delivered strong returns during major equity market sell-offs, a property sometimes called “crisis alpha.” When equity markets fell sharply in 2008, many systematic trend-following funds posted positive returns because they were short equities and long bonds and commodities that were trending. This is not guaranteed to repeat, but the structural reason it happens is real: large dislocations tend to produce sustained directional moves that trend systems capture.
The caveat is equally important. Historical evidence shows trend following can underperform for extended sideways regimes, sometimes for years at a time. The 2009–2019 period was difficult for many CTA trend programs because equity markets trended up with low volatility and few sharp reversals. Survival through those drawdowns is the defining challenge.
Trend following vs. momentum: what’s the actual difference?
Trend following is directional and time-series based. Momentum is cross-sectional and relative-strength based. Both exploit the tendency of assets to continue moving in the same direction, but they do it differently and they are not interchangeable.
- Trend following: Looks at a single asset’s own price history. Asks: “Is this asset trending up or down?” Holds positions for weeks to months. Applies to futures, forex, commodities, and equities individually.
- Momentum: Ranks assets against each other. Asks: “Which assets are outperforming their peers?” Rebalances monthly or quarterly. Primarily applied to equity portfolios (e.g., buying the top decile of S&P 500 stocks by 12-month return).
- Timeframe: Trend following is typically longer-duration; momentum strategies often rebalance on a 1–12 month lookback with monthly rebalancing.
- Selection logic: Trend following uses absolute price direction; momentum uses relative ranking.
- Instruments: Trend following dominates in futures and forex; momentum is most common in equity factor investing.
In portfolio construction, the two can complement each other. A trend-following allocation in futures provides diversification and crisis alpha potential. A momentum allocation in equities provides relative-strength exposure within a single asset class. They are not the same bet, which is why holding both can reduce correlation to a pure long-only portfolio.
How to build and backtest a simple trend-following strategy
Before you risk a dollar, you need to know whether your rule set has a positive expectancy on historical data. Here is the process, step by step.
- Pick one rule set and commit. Choose a single entry method (e.g., 20-day breakout), one filter (price above 200-day MA), one stop type (2x ATR), and one position-sizing rule (1% risk per trade). Do not mix rules mid-test. Changing parameters after seeing results is overfitting.
- Source clean historical data. Use adjusted price data that accounts for dividends and splits. For futures, use continuous contracts adjusted for roll. Free sources include Yahoo Finance for equities; paid sources like Norgate Data or CSI Data are more reliable for futures.
- Set your sample length. Use at least 10 years of data, ideally 20+. Shorter samples may not include a full market cycle with both trending and sideways regimes.
- Check for look-ahead bias. Every signal must use only data available at the close of the signal bar. If your 20-day high calculation includes today’s close, you have a bias. Calculate signals using yesterday’s data and execute at today’s open or close.
- Include realistic costs. Add slippage (at least 0.05–0.1% per trade for liquid equities; more for thinly traded futures) and commissions. Ignoring costs inflates results significantly on high-frequency systems.
- Run a walk-forward split. Use the first 70–80% of your data as the in-sample period for parameter selection. Test the final 20–30% out-of-sample without touching parameters. QuantInsti’s guidance specifically recommends walk-forward testing to avoid overfitting.
- Record these metrics: expectancy (average profit per trade), win rate, average win vs. average loss (R-multiple ratio), maximum drawdown, Sharpe ratio, and profit factor. Target a profit factor above 1.5 per TraderNest’s practical framework.
- Paper trade before going live. Run the system in a simulated account for at least one month, executing every signal as if it were real. This surfaces execution issues (slippage, order types, data delays) that backtests miss.
Minimum live-trade sample. Do not judge a trend-following system on 10 or 20 trades. Abandoning a system after a losing streak of 8 trades is almost always premature.
A practical template you can paper trade today
The template below is a starting point, not a finished system. Paper trade it, measure the metrics from the previous section, and adjust parameters only after you have a meaningful sample.
Template summary: Filter with price above the 200-day SMA. Enter long on a 20-day high breakout at the next day’s open. Trail the stop up as price rises, never moving it down.
Position-sizing formula:
Position size (units) = (Account equity × 0.01) ÷ (ATR × 2)
Worked example:
- Account equity: $50,000
- Risk per trade: 1% = $500
- 14-day ATR of the stock: $2.50
- Stop distance: 2 × $2.50 = $5.00
- Position size: $500 ÷ $5.00 = 100 shares
| Variable | Description | Sample value |
|---|---|---|
| Account equity | Total trading capital | $50,000 |
| Risk % | Max loss per trade as % of equity | 1% ($500) |
| ATR (14-day) | Average true range over 14 days | $2.50 |
| Stop multiple | ATR multiplier for initial stop | 2x |
| Stop distance | ATR × Stop multiple | $5.00 |
| Position size | Risk $ ÷ Stop distance | 100 shares |
| Entry trigger | 20-day high breakout | Price > 20-day high |
| Market filter | Price above 200-day SMA | Yes/No |
Pro Tip: For futures and leveraged crypto positions, overnight gap risk can blow through your stop. Futures also carry roll costs; factor in the roll yield when calculating net returns on commodity trend systems.
For readers who want a pre-built spreadsheet with this formula already embedded, Profitomics’ Stock Market Mastery ebook includes position-sizing calculators and trade-tracking templates you can use immediately.
Which markets and timeframes suit trend following best?
Commodities, futures, and some crypto markets tend to produce the cleanest trends. Large-cap equity indices trend more slowly and with more noise. Fixed income and currency markets sit somewhere in between.
Winton’s research highlights that trend following’s value includes access to commodities, bonds, and currencies that are hard to replicate in a long-only stock portfolio. The strategy can go short, which means it captures downtrends in commodity markets and currency pairs that a buy-and-hold equity investor would miss entirely.
| Market category | Typical holding period | Signal frequency | Key consideration |
|---|---|---|---|
| Commodity futures (oil, gold, grains) | 4–12 weeks | Medium | Roll costs; strong trend behavior |
| Currency futures / forex | 3–8 weeks | Medium-high | High liquidity; 24-hour market |
| Equity index futures | 6 weeks | Low-medium | Slow trends; upward bias limits shorting |
| Individual equities | 4–12 weeks | Medium | Earnings gaps; liquidity varies |
| Crypto (BTC, ETH) | 2–8 weeks | High | High volatility; funding costs on perpetuals |
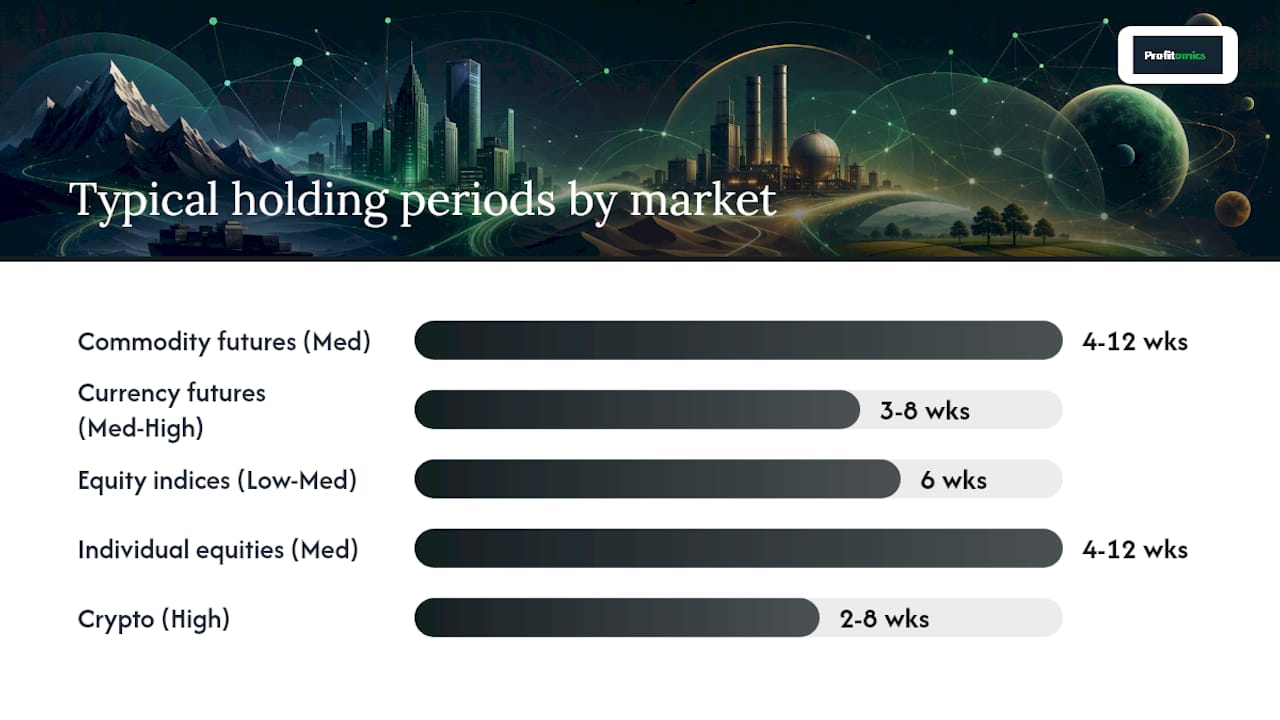
Practical liquidity notes. Stick to the most liquid contracts in each category: front-month crude oil, gold, and the major currency pairs for forex. Thin markets produce slippage that can erase a system’s edge. For crypto, use spot markets or well-established perpetual contracts on major exchanges rather than small-cap tokens, where spreads are wide and manipulation is common.
For readers interested in financial planning fundamentals alongside trading strategy, building a clear financial foundation before allocating capital to active trading is worth the time.
Futures contracts require rolling before expiration. If you are using a continuous contract in your backtest, confirm your data source handles the roll adjustment correctly, or your entry and exit prices will be distorted.
What are the real risks of trend following?
Trend following produces frequent small losses and occasional large wins. That is not a flaw in the system; it is the design. But it creates a specific psychological and financial challenge: you will spend most of your time losing small amounts while waiting for the rare large winner that makes the math work.
The main risks:
- Extended sideways regimes. When markets chop without direction, every breakout fails and every MA crossover reverses. A system that performs well in trending markets can lose steadily for 12–24 months in a range-bound environment.
- Long drawdowns. Even well-designed systems can experience drawdowns of 20–40% over extended periods. These are not signs the system is broken; they are a normal part of the return profile.
- Late entries. By definition, trend followers enter after the trend has started. In fast-moving markets, the entry price can be far from the eventual reversal, compressing the risk/reward ratio.
- Gap risk. Overnight news or earnings can gap a stock through your stop, producing a loss larger than your planned 1%. Futures and crypto are especially prone to this.
- Tail risk. In extreme market dislocations, correlations spike and diversification provides less protection than backtests suggest.
Realistic expectation: TraderNest’s framework notes that a typical trend-following system has a win rate below 45%. That means you will lose on the majority of individual trades. The system is profitable because the average winner is several times larger than the average loser, not because you win often.
Diversify across at least 5 uncorrelated markets. Stress-test your worst-case drawdown by assuming your three largest historical losses happen consecutively. If that scenario would wipe out your account or cause you to quit, reduce position size.
Why trend following suits beginners who want rules, not predictions
Most retail traders fail not because they lack intelligence but because they lack a system. They buy on hope, hold through losses, and sell winners too early. A trend following strategy inverts that behavior by design: the rules tell you when to enter, when to exit, and exactly how much to risk. There is no room for hope.
For Profitomics readers who are new to systematic trading, the right starting point is one rule set, one liquid market, and position sizes small enough that a losing streak feels educational rather than devastating. Journal every signal, whether you took it or not, and measure your actual execution against the system’s theoretical results. The gap between those two numbers tells you more about your behavioral edge than any backtest.
Scale only after you have 50+ live trades with a positive expectancy. Not after a good month. After 50 trades.
Profitomics gives you the templates so you can skip the spreadsheet build
Knowing the position-sizing formula is one thing. Having a spreadsheet that calculates it automatically, flags your entry signals, and tracks your R-multiples across every trade is what actually gets you from reading to trading.

Profitomics publishes practical financial education ebooks built specifically for traders who want to apply systematic strategies without starting from a blank page. The Stock Market Mastery ebook includes position-sizing calculators, trade-tracking spreadsheets, and a step-by-step framework for swing and systematic trading that maps directly onto the template in this guide. For traders applying trend rules to crypto, the Crypto Profit System delivers a risk-first framework with sizing tools calibrated for crypto’s higher volatility. Both are instant PDF downloads with companion spreadsheets. Pick the one that matches your market and start paper trading the same day.
Sources
The sources below were used to build this guide and are worth reading directly for deeper study.
- Winton | What is trend following?
- Trend following - Wikipedia
- Trend Following Strategy: 2026 Playbook | TraderNest
- How to Create a Robust Trend Following Strategy
- Trend Following Strategy: The Trading Approach That Profits in Any Market - The First Time Investor
- Trend Following Theory by Michael Covel (archive)
This article is for general educational purposes only and does not constitute financial or investment advice. Confirm any trading approach with a qualified financial professional before committing real capital.
This article is general information, not a substitute for advice from a qualified financial advisor. Consult a qualified financial professional about your own circumstances before acting on anything here.