Analyze a Stock in 30 Minutes: Beginner Checklist and Templates
Analyzing a stock means answering two separate questions: what is the business worth, and when is a good time to buy it? Fundamentals answer the first question by digging into earnings, debt, and cash flow. Technicals answer the second by reading price charts and momentum. Your first 30 minutes should cover three things: pull the latest 10-Q or 10-K from SEC EDGAR, check the EPS and debt trend, and confirm the price trend using moving averages, then cross-check anything questionable against FINRA.
TL;DR:
- Fundamental analysis should be your first step, focusing on revenue drivers, financial statements, ratios, and relative valuation to assess business quality and safety.
- Technical analysis employs price charts, moving averages, RSI, MACD, and volume to time entries and exits, with support and resistance levels guiding buy and sell signals.
- Combining fundamentals to identify good stocks and technicals to time purchases reduces the risk of chasing overbought stocks or buying deteriorating businesses.
- Relying solely on one ratio or ignoring key red flags like rising debt or shrinking cash flow can lead to misjudging a stock’s true risk and potential.
- Using structured templates for quick analysis and paper-trading before risking real capital helps develop disciplined investing habits and improves decision accuracy.
Table of Contents
- Fundamental vs. Technical Analysis: What Each One Tells You
- The Fundamental Analysis Checklist: Business, Financials, Valuation, Risk
- Technical Analysis for Beginners: Charts, Indicators, and Timing
- How to Turn Your Analysis Into a Buy Decision
- Where to Get Reliable Data for Your Analysis
- How Templates Speed Up Your First Analysis Pass
- How Macroeconomic Factors Shape Stock Performance
- A One-Week Plan to Start Analyzing Stocks
- Skip the Guesswork With Ready-Made Analysis Templates
- Where to Verify These Numbers Yourself
- Sources
- FAQ
Fundamental vs. Technical Analysis: What Each One Tells You
Fundamental analysis answers “is this a good business at a fair price?” Technical analysis answers “is now a decent time to buy or sell it?” They operate on different clocks. Fundamentals move slowly, tied to quarterly earnings and multi-year competitive positioning. Technicals shift daily, driven by supply, demand, and crowd psychology showing up on a chart.
New investors often want one method to do all the work. It doesn’t. A stock can also look great on a chart and be sitting on a balance sheet that’s quietly falling apart. That’s why Charles Schwab’s investor education guide frames the two as complementary rather than competing: use fundamentals to build your shortlist, then use technicals to decide when to act on it.
Here’s a rough breakdown of who leans on which method and why:
- Long-term investors (holding years) lean heavily on fundamentals, since business quality compounds over time and short-term price noise matters less.
- Swing traders (holding days to weeks) lean heavily technical, since they’re profiting from price movement, not business ownership.
- Most retail investors land somewhere in between, using fundamentals to pick candidates and technicals to time entries and exits.
If you’d rather skip individual stock analysis altogether, buying a broad index fund instead of picking stocks is a legitimate alternative, especially early in your investing life. But if you’re committed to picking individual names, both skills are worth building.
The Fundamental Analysis Checklist: Business, Financials, Valuation, Risk
Fundamental analysis has a natural order. Skip a step and you’ll misjudge the stock. Here’s the sequence that actually works:
- Understand how the company makes money. Read the business description in the 10-K. What are the actual revenue drivers? A company that sells software subscriptions behaves nothing like one that sells commodity chemicals.
- Read the primary filings, not a summary. Every U.S. public company files a 10-K annually and a 10-Q quarterly, and both are free on SEC EDGAR. The SEC’s own guide to reading a 10-K points you to three sections that matter most: the business overview, the risk factors, and Management’s Discussion and Analysis (MD&A), where executives explain what actually happened during the period and why.
- Work through the three financial statements. The income statement shows revenue and profit trends. The balance sheet shows what the company owns versus what it owes. The cash flow statement shows whether the business actually generates cash or just reports paper profits. Cash flow is the one people skip and shouldn’t: a company can show positive net income while quietly bleeding cash, and that gap is where accounting games hide.
- Calculate the core ratios. EPS (earnings per share) shows profit per share and its trend over several quarters matters more than any single number. The P/E ratio tells you how much you’re paying per dollar of earnings. P/S (price-to-sales) helps when a company isn’t profitable yet. Debt-to-equity (D/E) tells you how leveraged the business is relative to its peers.
- Anchor a rough valuation. You don’t need a discounted cash flow model as a beginner. Compare the P/E and P/S to direct competitors in the same industry, and build in a margin of safety, meaning you pay meaningfully less than your estimate of fair value so you have room for error.
- Run a quick solvency screen. Look at debt levels relative to cash flow and equity. The logic behind the Altman Z-Score, a formula combining five financial ratios to estimate bankruptcy risk, is worth knowing even if you never calculate it by hand: heavy debt plus shrinking margins plus weak liquidity is a combination that has preceded a lot of blowups.
Pro Tip: Pull up three competitors’ P/E and D/E ratios side by side before judging whether your target stock is “cheap” or “expensive.” A P/E of 25 means something different in software than it does in utilities.
FINRA’s guidance on evaluating stocks frames this whole process as five plain questions: how does the company make money, is there real demand for its product, how has it performed historically, is management competent, and how much debt is it carrying? If you can answer those five honestly, you’ve done real fundamental analysis, ratios and all.
Watch for red flags along the way: revenue growing while cash flow shrinks, debt climbing faster than earnings, footnotes disclosing pending litigation or accounting changes, and insider selling clustered around earnings releases — all key points discussed in ESG Insights — The ESG Intelligence Magazine.
Technical Analysis for Beginners: Charts, Indicators, and Timing
Once you know a business is sound, the chart tells you whether the crowd agrees with you right now. Start by pulling up a candlestick chart, which shows the open, high, low, and close for each period as a colored bar. Compare the current price to the stock’s 52-week high and low for quick context on where it sits in its own range, a basic idea covered well in Britannica’s explainer on stock analysis.
From there, four tools do most of the work for beginners:
- Moving averages (20-day, 50-day, 200-day) smooth out daily noise and show trend direction; price above the 200-day average generally signals a longer-term uptrend.
- RSI (Relative Strength Index) measures momentum on a 0 to 100 scale; readings above 70 suggest a stock may be overbought, below 30 suggest oversold.
- MACD (Moving Average Convergence Divergence) tracks the relationship between two moving averages and helps spot shifts in momentum before price fully reflects them.
- Volume confirms conviction; a breakout on heavy volume is more credible than the same move on a quiet trading day.
Schwab’s technical analysis guide covers support and resistance the same way most practitioners do: support is a price level where buying has repeatedly stepped in, resistance is where selling has repeatedly capped a rally. A breakout above resistance on strong volume often signals a genuine move; a pullback to a prior support level can be a lower-risk entry than chasing a stock after it’s already run up.
You’ll come across timing folklore like the “10 a.m. rule,” the idea that the first 30 to 60 minutes of trading are noisy and the market tends to settle by mid-morning, or references to a “3-5-7” pattern in candlestick sequences. Treat these as loose observations, not rules. They matter less than the trend itself.
A practical workflow: screen for candidates that pass your fundamental checklist, scan their charts for trend and momentum alignment, then set a stop-loss and price target before you buy, not after.
How to Turn Your Analysis Into a Buy Decision
Analysis without a decision framework is just trivia. Here’s how to convert your research into an actual position:
- Write a one-sentence investment thesis: why you’re buying, in plain language you could explain to a friend in ten seconds.
- Define your invalidation condition up front: the specific fact that would prove your thesis wrong. Structured frameworks that pair a written thesis with an explicit invalidation condition consistently produce cleaner decisions than “gut feel” investing.
- Set your stop-loss and price target before entering, not after you’re already emotionally attached to the position.
Before sizing the position, run it against a short portfolio checklist:
- Does this stock overlap with something you already own, or does it add real diversification?
- How correlated is it with your existing holdings during market stress?
- What percentage of your total portfolio would this position represent?
- What are you giving up by buying this instead of something else on your list?
Position sizing doesn’t need to be complicated. Many beginners cap any single stock at 5% of their portfolio and risk no more than 1% to 2% of total capital on any one trade, meaning the distance from entry to stop-loss determines how many shares you buy, not the other way around. Revisit every open position on a set cadence, monthly is reasonable for most people, and ask whether your original thesis still holds.
Where to Get Reliable Data for Your Analysis
Everything above is only as good as the numbers behind it. SEC EDGAR is the free, authoritative source for 10-K and 10-Q filings. Search the company, pull the most recent filing, and copy the revenue, net income, total debt, and cash flow figures directly from the statements rather than trusting a summary site.
FINRA’s Market Data Center and most brokerage platforms will calculate ratios like P/E and EPS for you, but always spot-check aggregator numbers against the actual filing since data providers occasionally lag or miscategorize one-time charges.
For a lightweight toolkit, you generally need:
- A free stock screener to filter by sector, market cap, or valuation range.
- A charting platform with moving averages, RSI, and volume overlays built in.
- A simple spreadsheet template to log EPS trends, ratios, and your thesis over time.
Save the latest 10-K, the last two 10-Qs, and your ratio snapshot for every stock you seriously consider. That folder becomes your evidence trail when you revisit the decision six months later.
How Templates Speed Up Your First Analysis Pass
A structured template turns a vague research session into a repeatable 15 to 30 minute routine. A good one includes four sections: a one-line business thesis, a ratio table (EPS, P/E, P/S, D/E), a quick valuation anchor against peers, and a written invalidation condition.
Use the template for a fast first pass on every candidate, then reserve a deeper dive, full filing read, competitor comparison, multi-year trend, for the two or three names that survive it. Before committing real money, paper-trade the idea or run it through a spreadsheet model to see how your thesis would have performed.
- Business thesis (one sentence)
- Ratio table: EPS, P/E, P/S, D/E
- Peer valuation comparison
- Invalidation condition
Pro Tip: Fill out the template within 24 hours of your first read of the 10-K, while the details are still fresh, then set a calendar reminder to revisit it after the next quarterly filing.
How Macroeconomic Factors Shape Stock Performance
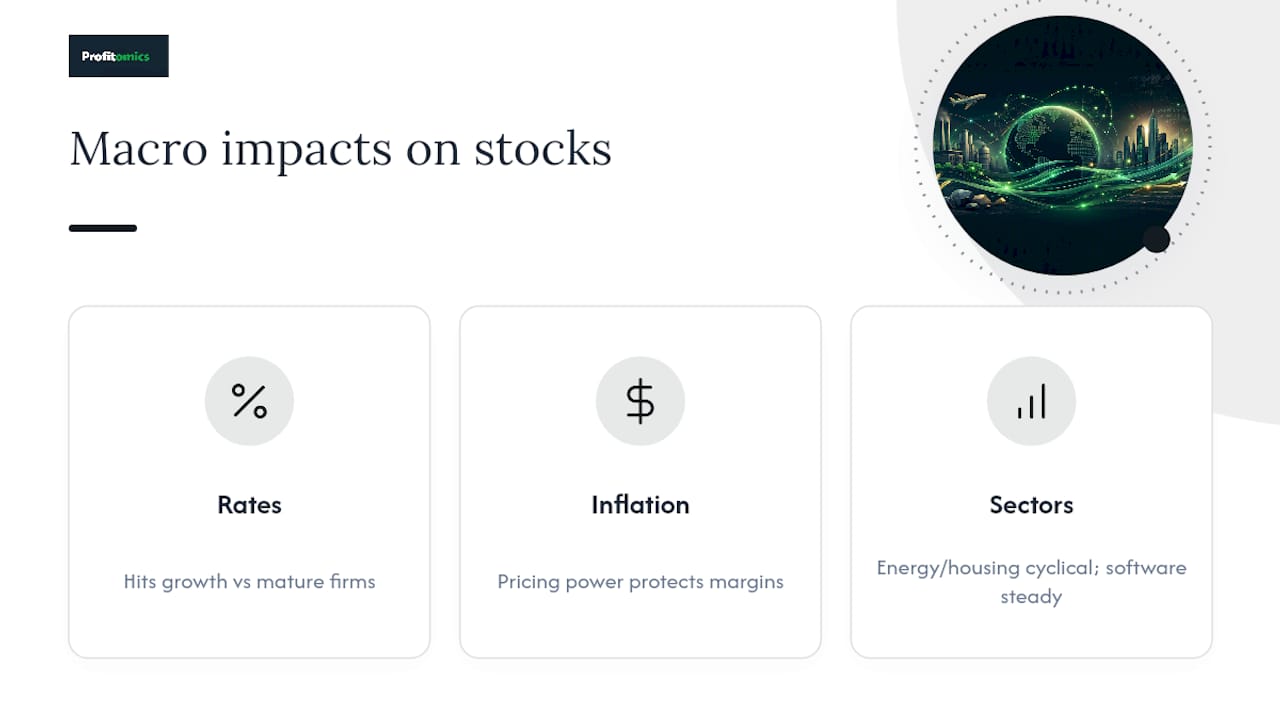
A great business can still be a bad stock to buy at the wrong point in the economic cycle. Interest rates set by the Federal Reserve affect nearly every valuation model indirectly: higher rates make future earnings worth less today, which is why growth stocks with earnings expected years out tend to fall harder when rates rise than mature, cash-generating companies do.
Inflation matters differently depending on the business. Companies with pricing power, the ability to raise prices without losing customers, tend to protect margins during inflationary periods. Companies selling commodity products with thin margins often can’t, and their earnings get squeezed.
Broader indicators worth tracking loosely include GDP growth, unemployment trends, and sector-specific cycles. Energy, housing, and industrials tend to move with economic expansions and contractions more than software or healthcare does, which tend to be steadier through the cycle.
None of this means you should try to time the macro perfectly, most professional forecasters can’t do that reliably either. It means you should read a stock’s fundamentals in context. A retailer with rising debt looks a lot riskier heading into a period of rising rates than the same balance sheet would during a period of falling rates. Treat macro conditions as a lens you look through, not a separate checklist item you check off once and forget.
A One-Week Plan to Start Analyzing Stocks
Pick one stock you already know something about. Day one, run the fundamental checklist: filings, ratios, thesis. Day two, run the chart: moving averages, RSI, support and resistance. Day three, write your thesis and invalidation condition, then paper-trade the position for 30 days before risking real money.
Watch for three mistakes I see beginners make constantly: leaning on one ratio (usually P/E) while ignoring everything else, buying illiquid stocks where you can’t exit cleanly, and skipping the invalidation condition entirely, so nothing ever tells you when you’re wrong. Track every decision in writing. The habit of reviewing your own calls, especially the bad ones, teaches you faster than any book will.
— Kai
Skip the Guesswork With Ready-Made Analysis Templates
Building your own ratio tables and thesis trackers from scratch works, but it’s slow the first dozen times you do it. Stock Market Mastery gives you the templates, checklists, and spreadsheet models already built, so the checklist covered in this article becomes fill-in-the-blank instead of build-from-nothing.

A digital educational resource maps directly onto the steps above: a business thesis template, a pre-built ratio table for EPS, P/E, P/S, and D/E, a valuation worksheet, and a swing-trading framework for the technical side. It is delivered instantly as a PDF with no subscription required. If you’d rather start with the free basics before buying anything, browse the full Profitomics library first. Either way, your next move is the same: open the template, plug in your first stock, and see your thesis on paper within 30 minutes.
Where to Verify These Numbers Yourself
Every figure and rule in this article traces back to a primary source. Pull filings directly from SEC EDGAR and read the SEC’s own 10-K reading guide for filing structure. Check ratio definitions and evaluation criteria against FINRA’s investor guidance, and see Schwab’s breakdown for how fundamentals and technicals work together in practice.
This article is general information, not a substitute for advice from a qualified financial advisor. Consult a qualified financial professional about your own circumstances before acting on anything here.
Sources
- Evaluating stocks — FINRA
- EDGAR company search — U.S. Securities and Exchange Commission (SEC)
- How to pick stocks using fundamental and technical analysis — Charles Schwab
FAQ
What Is the 3-5-7 Rule in Stocks?
It’s not a regulatory standard, just a rough discipline framework.
What Is the 10 A.M. Rule in Stocks?
It refers to the observation that the first 30 to 60 minutes of trading are often volatile and less reliable, so some traders wait until after 10 a.m. Eastern to judge the day’s real trend before acting.
How Does Warren Buffett Analyze Stocks?
Buffett’s public writings and interviews emphasize buying businesses with a durable competitive advantage, or “moat,” run by trustworthy management, at a price below his estimate of intrinsic value, then holding for the long term rather than trading around short-term price moves.
What Is the Best Stock to Put $1,000 in Right Now?
There’s no single answer, since the right stock depends on your own research, risk tolerance, and time horizon. Run any candidate through the fundamental and technical checklist in this article, or start with a free spreadsheet template to compare a few options side by side before committing money.