Best Investing Spreadsheet Templates for U.S. Investors 2026

The fastest way to get a working investment tracking spreadsheet today is to copy a ready-made Google Sheets or Excel starter template, enable live price updates, and wire in XIRR for accurate annualized returns. The Profitomics portfolio template, included with the Stock Market Mastery ebook, is the recommended starting point for U.S. individual investors: it arrives XIRR-ready, covers dividends and transaction logging, and opens in both Google Sheets and Excel 365 without modification.
Three things to do right now:
- Copy or download the template to your personal Drive or desktop.
- Enable live prices using the GoogleFinance function (Sheets) or the Stocks data type (Excel 365).
- Import your transactions, then run XIRR to get a real annualized return figure.
Key Takeaways
A ready-made investing spreadsheet template with XIRR support, a transaction ledger, and live price updates covers everything a U.S. individual investor needs to track performance accurately and avoid common tax-reporting mistakes.
| Point | Details |
|---|---|
| Start with a proven template | Copy a ready-made Google Sheets or Excel starter rather than building from scratch to save setup time. |
| XIRR is the right return metric | Use XIRR with signed, chronological cash flows for accurate annualized returns; simple percentage gains mislead. |
| Live prices need the right tool | Use GoogleFinance in Sheets or the Stocks data type in Excel 365; older Excel versions lack this feature. |
| Spreadsheets aren’t for tax filing | Use your broker’s Form 1099-B for IRS reporting; free templates don’t handle lot-level or wash-sale accounting. |
| Profitomics template | The Stock Market Mastery bundle includes a prebuilt XIRR-ready tracker with U.S. tax notes and a setup guide. |
Table of Contents
- Which investing spreadsheet template is right for you?
- How to get and open investing templates in Google Sheets or Excel
- Key features every good investing spreadsheet should include
- How templates keep market prices current
- Calculating performance correctly: XIRR and why it matters
- Limits of free spreadsheets and tax warnings for U.S. investors
- Quick customization checklist for your downloaded template
- Where to find reliable starter templates for U.S. investors
- Why spreadsheets still beat black-box portfolio apps
- The Profitomics portfolio template: what you get and how to access it
- Sources
Which investing spreadsheet template is right for you?
The honest answer is that most investors grab a template that’s too complex, spend an hour configuring it, and abandon it by week two. Match the template to where you actually are.
Beginners need a single holdings table, a current-value column, and a simple gain/loss number. Anything with pivot tables, custom scripts, or a 10-tab workbook is overkill at this stage. Prioritize clarity over features.
Intermediate investors tracking 10–30 positions across a taxable account and an IRA benefit from a transaction ledger, dividend log, and XIRR-based returns. This is the sweet spot for the Profitomics starter template.
Advanced users who want lot-level cost-basis tracking, wash-sale flags, or multi-currency FX conversion will likely need to customize heavily or use a specialist tool alongside any free template.
Crypto-heavy portfolios add a layer of complexity: prices update differently, there’s no native GoogleFinance ticker for many tokens, and U.S. tax treatment of crypto disposals requires careful lot tracking. If crypto is a significant slice of your holdings, the Crypto Profit System framework covers the tracking logic in detail.
Google Sheets vs. Excel: choose Sheets if you want cross-device access, real-time collaboration, and the GoogleFinance function with no add-ins required. Choose Excel 365 if you’re already in the Microsoft ecosystem, need advanced formula power, or want STOCKHISTORY for historical price validation. Older Excel versions (pre-365) lack the Stocks data type entirely, so check your version before downloading an .xlsx template that depends on it.
Before you download anything, have these ready: your broker statements (or a CSV export of transactions), the tickers for every position you hold, and a decision on how often you want prices to refresh (daily is fine for most long-term investors).
Pro Tip: Start with a 90-day transaction window rather than importing your full history. Verify XIRR and current values against your broker statement before adding years of data. Fixing a formula error across 50 rows is far easier than across 500.
How to get and open investing templates in Google Sheets or Excel
Google Sheets
-
Open the shareable template preview link. Google will show a preview with a “Use Template” button.
-
Click Use Template. Google copies the file into your Drive as a new, fully editable spreadsheet. The original stays read-only.
-
Rename the copy immediately (e.g., “Portfolio Tracker 2026 — Working Copy”) so you don’t confuse it with future master copies.
-
Check the Extensions > Apps Script menu. If the template uses a custom script, review what it does before authorizing it. Legitimate trackers typically use scripts only to refresh prices or sort rows.
Excel 365
- Download the .xlsx file from the template source.
- Open it in Excel 365. If you see a yellow Protected View bar, click Enable Editing only after confirming the source is trustworthy.
- Check for macros: go to File > Info > Enable Content. Avoid enabling macros from unknown sources.
- Verify that the Stocks data type is available: select a cell, go to the Data tab, and look for the Stocks button. If it’s missing, your Excel version doesn’t support it. Microsoft 365 is required for this feature.
Compatibility notes
Google Sheets templates that use GOOGLEFINANCE() will show #NAME? errors when opened in Excel. Those cells need to be replaced with Excel’s Stocks data type or a manual price column. Conversely, Excel templates using STOCKHISTORY won’t work in Sheets. Always check which price-update method a template uses before switching platforms.
Community-built trackers, like the open-source Google Sheets tracker on GitHub, often include a built-in “Full Guide” tab that walks through setup step by step. Read it before touching the data tabs.
Pro Tip: Keep your downloaded original as a locked master copy. Duplicate it each time you start fresh, and do all transaction entry in the working copy. If a formula breaks, you can restore from the master in under a minute.
Key features every good investing spreadsheet should include
A template that looks impressive but lacks the right structure will give you wrong numbers. Here’s what actually matters.
Holdings table. At minimum: ticker symbol, number of shares, average cost per share, and total cost basis. Without cost basis, you can’t calculate realized or unrealized gains correctly.
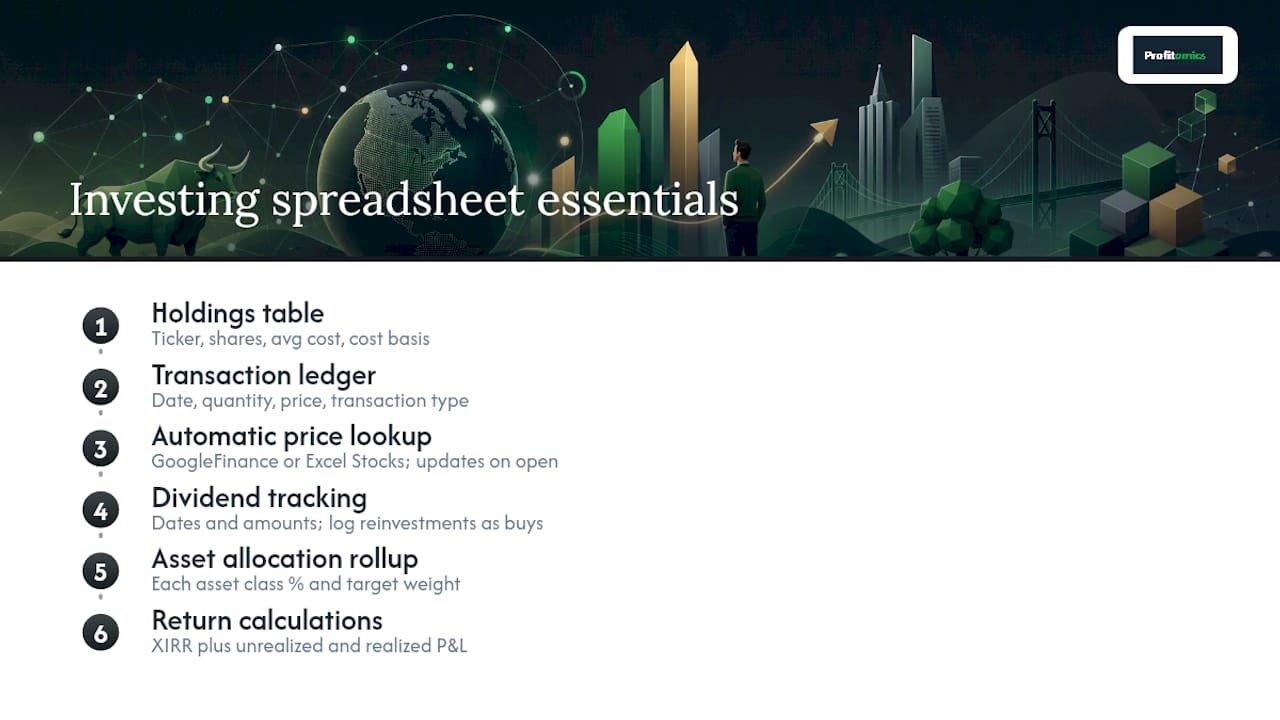
Transaction ledger. Every buy, sell, dividend, and fee logged with a date, quantity, price, and transaction type. This is the foundation for XIRR. Skip it and your return numbers are guesses.
Automatic price lookup. The GoogleFinance function in Sheets or the Stocks data type in Excel 365 pulls current prices without manual entry. Prices typically update when you open the file or refresh the sheet, not in real time. That’s fine for long-term tracking.
Dividend and income tracking. A separate column or tab for dividend payments, with dates and amounts, feeds both your income totals and your XIRR calculation. If you reinvest dividends, log each reinvestment as a separate buy transaction.
Asset allocation rollup. A summary section showing each asset class as a percentage of total portfolio value, with a target weight column.
Return calculations. XIRR for annualized cash-flow-aware returns, plus separate columns for unrealized P&L (current value minus cost basis) and realized P&L (from closed positions). The Vertex42 investment tracker is a well-documented example of how these columns fit together.
Ease of use. Input-only cells should be clearly marked (a different background color works well). Formula cells should be locked so an accidental keystroke doesn’t corrupt a calculation. Written instructions inside the file save hours of troubleshooting.
Pro Tip: Color-code your input cells in yellow and lock everything else. It takes five minutes to set up and prevents the single most common spreadsheet disaster: overwriting a formula with a number and not noticing for weeks.
How templates keep market prices current
No method is perfect. Each has real tradeoffs.
| Method | Platform | Update frequency | Limitations |
|---|---|---|---|
| GoogleFinance function | Google Sheets | On open / manual refresh | 15–20 min delayed quotes; limited to stocks, ETFs, mutual funds, and some FX pairs; no crypto |
| Stocks data type | Excel 365 | On refresh (manual or scheduled) | Requires Microsoft 365 subscription; availability varies by exchange; no real-time feed |
| STOCKHISTORY function | Excel 365 | On recalculation | Historical data only; field availability varies by symbol and exchange |
| Third-party add-ins (e.g., MarketXLS) | Excel | Near real-time (paid tier) | Requires paid subscription and API credentials; privacy considerations |
| Manual entry | Both | As often as you update | No automation; reliable for any asset class including crypto and private holdings |
GoogleFinance is the easiest starting point for Sheets users. The syntax is straightforward: =GOOGLEFINANCE("AAPL","price") returns the current price. It handles most U.S. stocks and ETFs without any configuration. The catch is that quotes are delayed by roughly 15–20 minutes and the function occasionally returns errors for tickers that have changed symbols or been delisted.
Excel’s Stocks data type works differently: you type a company name or ticker into a cell, convert it to the Stocks type via the Data tab, and then use the field selector to pull price, change, market cap, and more. Microsoft documents this feature as part of Microsoft 365. It’s clean and doesn’t require formulas, but it’s not available in standalone Excel versions.
STOCKHISTORY is the Excel function for pulling a price series over a date range. It’s useful for validating historical returns or building a chart, but it returns historical data only. Microsoft’s STOCKHISTORY documentation notes that availability and exact fields vary by exchange and symbol, so always cross-check important figures against your broker’s data.
For crypto and less common assets, manual entry remains the most reliable fallback. Third-party add-ins like MarketXLS can provide live formulas in Excel, but they come with a subscription cost and require sharing API credentials with a third-party service.
Calculating performance correctly: XIRR and why it matters
Simple return calculations lie to you. XIRR accounts for the timing of each cash flow and gives you the true annualized rate. That’s the number worth tracking.
XIRR requires two things: a column of cash flows (negative for money going in, positive for money coming out or the final portfolio value) and a matching column of dates. The function syntax in both Excel and Google Sheets is identical:
=XIRR(values_range, dates_range)
A few rules that trip people up:
- Cash flows must be in chronological order. XIRR will return an error or a nonsensical result if dates are out of sequence.
- Sign convention matters. Purchases and deposits are negative (cash leaving your pocket). Sales, dividends received, and the current portfolio value are positive.
- The final row should include today’s date and the current total portfolio value as a positive number. This closes the calculation.
- Wrap it in
IFERRORto handle edge cases:=IFERROR(XIRR(values_range, dates_range), "Check data")
The most common mistake is feeding periodic portfolio balances into XIRR instead of actual cash flows. That produces a number, but it’s not your real return. XIRR needs to see the money you put in and took out, not snapshots of what the portfolio was worth on random dates.
Pro Tip: Before trusting your XIRR result, run it on a simple test case: one $10,000 investment on January 1 and a $11,000 value on December 31. If it doesn’t, your date format or sign convention is wrong.
Limits of free spreadsheets and tax warnings for U.S. investors
Free investing spreadsheet templates are built for performance monitoring, not IRS reporting. That distinction matters when tax season arrives.
Most templates don’t handle tax-lot accounting: the ability to track which specific shares you bought on which date and at what price, then apply FIFO, LIFO, or specific-identification rules when you sell. Without lot-level tracking, you can’t accurately calculate your taxable gain or loss on a partial sale.
They also miss wash-sale adjustments. If you sell a position at a loss and repurchase the same or a substantially identical security within 30 days before or after the sale, the IRS disallows that loss under the wash-sale rule. A standard spreadsheet won’t flag this automatically.
What to do instead:
- Use your broker’s official tax forms (Form 1099-B) for actual tax filing. Your broker tracks lot-level cost basis and wash-sale adjustments as required by law.
- If you want to model tax scenarios before year-end, use tax software that supports lot-level reporting, or consult a CPA who works with investors.
- Keep your spreadsheet as a performance and allocation tool, not a substitute for your broker’s records.
Pro Tip: Export a CSV of your transactions from your broker at least once a quarter and save it alongside your spreadsheet. If your broker changes platforms or you switch brokers, that export is your backup record.
This article is general information, not tax or financial advice. Confirm your specific situation with a qualified tax professional or your broker’s tax documents.
Quick customization checklist for your downloaded template
A downloaded template reflects someone else’s portfolio. These steps make it yours.
- Back up the master copy. Duplicate the file before touching anything. Label it “Master — Do Not Edit.”
- Set your currency. If all your holdings are in USD, you may not need to change anything. If you hold foreign-listed stocks or ADRs with FX exposure, add an FX rate column and a base-currency conversion formula.
- Add your accounts. Create a separate tab or section for each account (taxable brokerage, Roth IRA, 401(k)). A summary tab should roll up totals across all accounts.
- Import transaction history. Start with the past 12 months. Enter each transaction: date, ticker, type (buy/sell/dividend), quantity, price per share, and any fees. Keep the sign convention consistent with your XIRR setup.
- Enable price updates. In Sheets, replace any placeholder price cells with
=GOOGLEFINANCE(ticker_cell,"price"). In Excel 365, convert ticker cells to the Stocks data type. - Lock formula cells. Select all non-input cells, go to Format > Cells > Protection, and check “Locked.” Then protect the sheet with a password you’ll remember.
- Add a dividend column. If the template doesn’t have one, insert a column in the transaction ledger for dividend payments. Log each payment as a positive cash flow on the ex-dividend date.
- Set target allocation weights. In the allocation summary tab, add a “Target %” column next to “Actual %.” A simple formula like
=IF(ABS(actual-target)>0.05,"Rebalance","OK")gives you an instant flag.
Pro Tip: Enter two or three test transactions and verify that your XIRR result and current portfolio value match what your broker shows before importing your full history. A 30-minute sanity check prevents hours of debugging later.
Where to find reliable starter templates for U.S. investors
Several solid free options exist before you consider a paid template:
- GitHub open-source tracker — automated Sheets tracker supporting stocks, ETFs, bonds, and crypto; requires some comfort with Apps Script for customization.
- Vertex42 investment tracker — Excel-based, well-documented, with XIRR support and a clean transaction log; good for intermediate Excel users.
- NobodyToldMike free tracker — includes a built-in guide tab that walks through setup; useful for beginners who want hand-holding inside the file.
The Profitomics template stands out for one practical reason: it’s built around the same step-by-step investment system taught in the ebook, so the column structure and formulas match the workflow you’re learning. Free generic templates require you to adapt your process to their structure. This one works the other way around.
Why spreadsheets still beat black-box portfolio apps
Most portfolio tracking apps show you a number and ask you to trust it. A spreadsheet shows you the formula.
That auditability is the real argument for building and maintaining your own investment tracking spreadsheet. When an allocation looks off, you can see exactly which position moved the weight. No app gives you that level of transparency without a premium subscription and a willingness to hand over your brokerage credentials.
There’s also a teaching dimension that apps miss entirely. Building or customizing a spreadsheet forces you to understand what cost basis actually means, why XIRR differs from a simple percentage gain, and how dividends affect total return. That understanding compounds. An investor who knows how to read their own spreadsheet makes better decisions than one who reads a dashboard they didn’t build.
The tradeoff is real: spreadsheets require maintenance, they don’t send push notifications, and they won’t automatically import trades. For most individual investors tracking a manageable number of positions, that’s a reasonable price for full control and zero subscription fees. The Profitomics approach to financial education is built on this premise: practical systems you understand beat sophisticated tools you don’t.
The Profitomics portfolio template: what you get and how to access it

The Profitomics portfolio template is the practical centerpiece of the Stock Market Mastery ebook. Where most free templates hand you a blank spreadsheet and wish you luck, this one arrives pre-structured for the way U.S. individual investors actually work: a transaction ledger with correct XIRR sign conventions already set up, a dividend tracking section, a holdings summary with cost basis and unrealized P&L, and a set of U.S. tax-awareness notes that flag what your spreadsheet can and can’t do at tax time.
The bundle also includes a step-by-step setup guide (so you’re not reverse-engineering someone else’s formulas) and email support for basic setup questions. It’s compatible with both Google Sheets and Excel 365.
For investors who also hold crypto, the Crypto Profit System ebook covers the tracking and risk framework for that asset class specifically.
Get the full bundle at Profitomics and have a working, XIRR-ready portfolio tracker set up today.