P/E Ratio Explained Simply for New Investors

The P/E ratio is a stock’s current price divided by its earnings per share (EPS). That’s it. If a stock trades at a price and earns per share, its P/E is the ratio of price to earnings per share.
- P/E shows what you’re paying for $1 of earnings. A P/E of 15 means investors pay $15 for every $1 the company earns annually.
- Use it for comparisons, not in isolation. A P/E only tells you something meaningful when you stack it against peers or the company’s own history, as Investopedia and Investor.gov both emphasize.
- Low P/E isn’t automatically cheap; high P/E isn’t automatically expensive. Context — growth rate, sector, and earnings quality — changes everything.
Key Takeaways
The P/E ratio is most useful as a relative comparison tool, not a standalone buy or sell signal, and its meaning depends entirely on earnings quality, sector context, and growth expectations.
| Point | Details |
|---|---|
| Core formula | P/E = stock price ÷ EPS; a P/E of 8 means roughly 8 years of flat earnings to recover your cost. |
| Trailing vs. forward | Trailing P/E uses confirmed earnings; forward P/E uses estimates — check both before concluding. |
| No universal “good” P/E | Sector norms vary widely; compare to industry peers and the company’s own historical range. |
| Distortions are common | One-offs, buybacks, and cyclical earnings can all make P/E misleading — always check adjusted EPS. |
| When P/E fails, use alternatives | Negative or erratic earnings call for EV/EBITDA or P/S; growth comparisons call for PEG. |
This article is for general educational purposes only and does not constitute investment advice. Always consult a qualified financial professional before making investment decisions.
This article is general information, not a substitute for advice from a qualified financial advisor. Consult a qualified financial professional about your own circumstances before acting on anything here.
Table of Contents
- What the P/E ratio measures and why investors use it
- How to calculate the P/E ratio: formula and worked example
- The three main types of P/E and when to use each
- How to interpret P/E: peers, history, and what “good” really means
- When P/E misleads: distortions and red flags to check
- Metrics to use alongside P/E
- Your five-step checklist when you see a P/E number
- The part most guides get wrong about P/E
- Sources
What the P/E ratio measures and why investors use it
The P/E ratio is a relative valuation tool. It doesn’t tell you a stock’s intrinsic worth; it tells you how the market prices that company’s earnings compared to something else. Compare a retailer’s P/E to other retailers, or compare a company’s current P/E to where it traded five years ago. That comparison is where the signal lives.
Earnings are an accounting figure, and that matters more than most beginners realize. Net income can be inflated by one-time asset sales or deflated by non-cash write-downs. Different analysts also use different EPS definitions: basic, diluted, adjusted, or GAAP. The P/E you see on a quote page may not match the one on a research report, and the difference is usually which EPS definition each source used.
A P/E in a moderate range often is treated as a rough “fairly priced” benchmark, but that range is heavily sector-dependent and breaks down quickly outside of mature, slow-growth industries. A software company at P/E 30 may be cheaper than a utility at P/E 14 once growth is factored in.
Source: Wikipedia — Price-to-earnings ratio
How to calculate the P/E ratio: formula and worked example
The formula has two equivalent forms. The first is the most common:
P/E = Stock Price ÷ Earnings Per Share (EPS)
The second uses company-level figures:
P/E = Market Capitalization ÷ Net Income
Both should produce the same number. In practice, they can differ slightly when the share count used in the EPS calculation doesn’t perfectly match the share count implied by market cap, particularly when diluted shares are involved. Wall Street Prep notes this is the most common source of small discrepancies between the two methods.
Worked example: step by step
| Input / Step | Value |
|---|---|
| Current stock price | $24.00 |
| Earnings per share (EPS) | $3.00 |
| P/E ratio (price ÷ EPS) | 8x |
| “Years of payback” interpretation | ~8 years of current earnings to recover the price |
Here’s how to read that result:
- Divide the stock price ($24) by EPS ($3).
- The result, 8, is the P/E multiple.
- Interpret it as roughly 8 years of today’s earnings needed to cover what you paid, assuming earnings stay flat. Wikipedia’s payback framing makes this intuition concrete for new investors.
- Compare that 8x to the industry average and the company’s own historical range.
What if earnings are zero or negative? A loss-making company has no meaningful P/E. Most financial sites display “N/A” rather than a negative number, because a negative P/E has no useful interpretation. Seeing N/A on a quote page simply means the company isn’t currently profitable.
The three main types of P/E and when to use each
Investopedia draws a clean line between the two most common variants: trailing P/E uses confirmed, reported earnings; forward P/E uses analyst estimates.
- Trailing twelve months (TTM) P/E: Built from the last four quarters of actual reported earnings. It’s objective and audited. The limitation is that it looks backward — it won’t capture a business that just turned a corner.
- Forward P/E (NTM): Uses analysts’ consensus estimates for the next 12 months. Useful for growth-oriented comparisons, but analyst forecasts can be wrong, and companies routinely miss or beat them.
- Normalized / adjusted P/E: Strips out one-time items (restructuring charges, asset sale gains) to show what “normal” earnings look like. Helpful when a single quarter distorts the TTM figure.
Pro Tip: Start with trailing P/E to see what the company actually delivered. Then check forward P/E to understand what the market is pricing in. If those two numbers diverge sharply, that gap is worth investigating before you draw any conclusions.
How to interpret P/E: peers, history, and what “good” really means
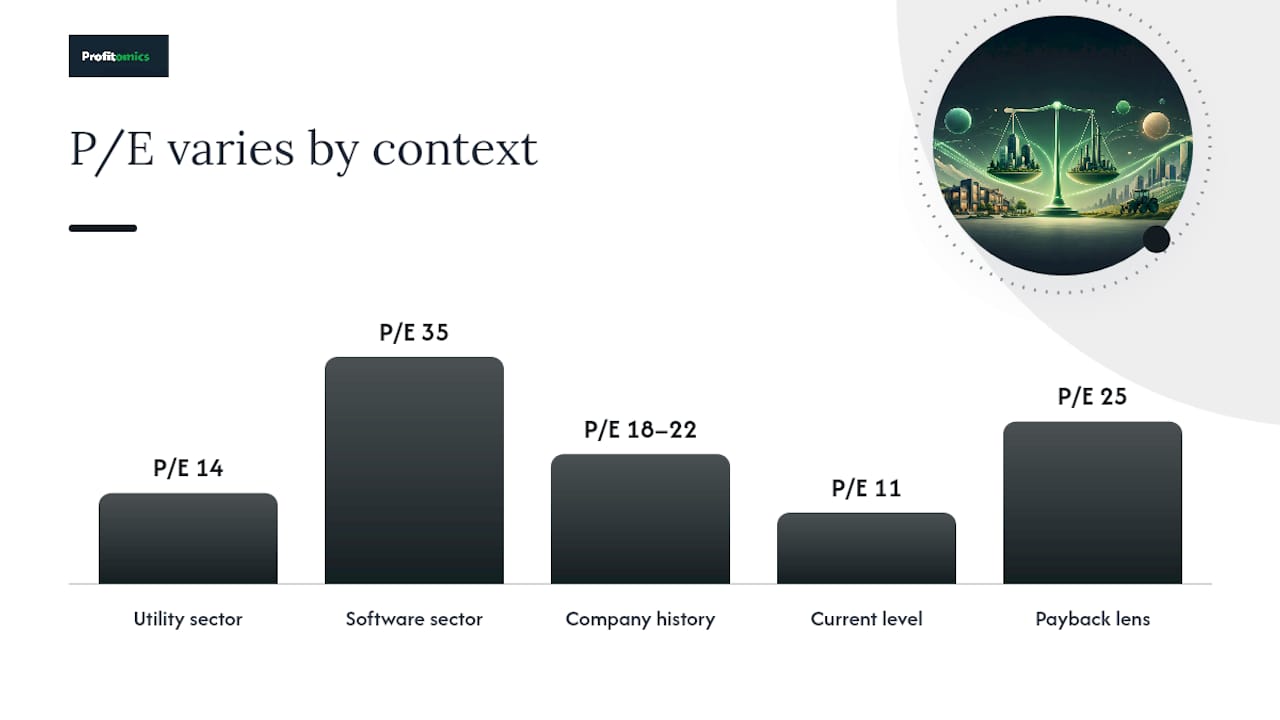
There is no universal good P/E. The right benchmark depends on the sector, the company’s growth rate, and the interest rate environment. Fidelity’s guidance frames it well: a higher-than-average P/E can signal expected growth or overvaluation, and a lower-than-average P/E can signal pessimism or a genuine opportunity. You can’t tell which without context.
A practical way to build that context:
- Compare to industry peers. A utility trading at P/E 14 and a software firm at P/E 35 aren’t directly comparable. Utilities grow slowly and pay dividends; software firms often reinvest everything for faster growth. Each sector has its own normal range.
- Compare to the company’s own history. If a stock usually trades at P/E 18–22 and now sits at 11, something changed. Find out what before assuming it’s cheap.
- Use the payback-years lens. A P/E of 25 means 25 years of flat earnings to recover your price. That’s only reasonable if earnings are growing fast enough to shorten that timeline meaningfully.
When P/E misleads: distortions and red flags to check
A clean-looking P/E can hide real problems. Fidelity identifies several common distortions worth checking before trusting any P/E number at face value:
- One-time gains or losses: A large asset sale inflates EPS for one quarter, compressing P/E artificially. Check: look at adjusted or normalized EPS in the earnings release.
- Share buybacks: Reducing share count raises EPS even when net income is flat, making P/E look lower. Check: compare EPS growth to revenue growth — if they diverge, buybacks may explain the gap.
- High debt levels: A heavily leveraged company can show a low P/E while carrying risk that equity-only metrics miss entirely. Check: pair P/E with EV/EBITDA, which accounts for debt.
- Cyclical earnings: Mining, energy, and auto companies earn far more at cycle peaks than troughs. A low P/E at peak earnings is often a warning, not a bargain. Check: look at earnings over a full cycle, not just the last 12 months.
- Accounting adjustments: GAAP earnings and adjusted earnings can differ substantially. Check: read the reconciliation table in the earnings release footnotes.
Pro Tip: Before trusting any P/E, open the most recent earnings release and find the adjusted EPS reconciliation. If adjusted EPS is significantly higher than GAAP EPS, ask why — the answer is usually in the footnotes.
Metrics to use alongside P/E
When P/E is distorted or unavailable, these four alternatives each solve a specific problem.
PEG ratio divides P/E by the expected earnings growth rate. A P/E of 30 with 30% growth is a PEG of 1.0, which many analysts treat as fairly valued. Use PEG when comparing companies with different growth profiles.
EV/EBITDA compares enterprise value (equity plus net debt) to operating earnings before interest, taxes, depreciation, and amortization. Because it includes debt, it’s more useful than P/E when comparing companies with different capital structures. Prefer it for capital-intensive industries like telecom or manufacturing.
Price-to-book (P/B) compares price to net asset value. It’s most relevant for banks and insurers, where the balance sheet is the business. For asset-light tech firms, it tells you almost nothing useful.
Price-to-sales (P/S) works when earnings are negative or erratic. Early-stage companies and turnaround situations often have no meaningful EPS, so P/S gives at least a rough sense of how much the market values each dollar of revenue.

A simple workflow: start with P/E. If earnings are negative or heavily distorted, switch to EV/EBITDA or P/S. If growth rate is the main question, add PEG.
Your five-step checklist when you see a P/E number
- Identify which P/E it is. Trailing, forward, or adjusted? The source matters.
- Compare to industry peers. A P/E only has meaning relative to something.
- Check for recent one-offs. Scan the last earnings release for large non-recurring items.
- Confirm EPS quality. Trace whether EPS growth came from revenue growth, margin expansion, or share count reduction.
- Consider an alternative metric. If earnings are erratic or debt is high, add EV/EBITDA or PEG before deciding.
One counterexample worth keeping in mind: a cyclical stock at P/E 6 during a commodity boom looks cheap by any heuristic. But if earnings are near a cycle peak, that “cheap” multiple can expand to P/E 40 within two years as earnings collapse, even if the stock price barely moves.
Pro Tip: When a P/E looks unusually low or high, trace the EPS line first. Did revenue drive it, or did margins spike? A margin spike that’s not repeatable makes the P/E misleading.
If you want a structured path from P/E basics to full stock analysis, Profitomics’s Stock Market Mastery ebook walks through valuation, swing trading, and long-term compounding in one practical guide. For a broader foundation across stocks, crypto, and passive income, the full Profitomics library is worth a look.
The part most guides get wrong about P/E
Most beginner articles treat P/E as a scoring system: low score means buy, high score means avoid. That framing is wrong, and it’s the most common mistake new investors make with this metric.
P/E is a question, not an answer. A P/E of 8 asks: “Why is the market pricing this so cheaply?” Sometimes the answer is a genuine bargain. More often it’s declining earnings, a cyclical peak, or a structural problem the market already priced in. The number itself tells you nothing. The investigation it triggers is where the value is.
The “years of payback” framing is genuinely useful, but only as a starting point. A P/E of 25 is only alarming if earnings are flat. The ratio is static; the business isn’t.
What actually matters is whether the earnings figure in the denominator is real, repeatable, and growing. Get that right, and the P/E multiple almost interprets itself. Skip that step, and no amount of ratio-reading will protect you from a bad investment.
Sources
- Investor
- Price-to-Earnings (P/E) Ratio: Definition, Formula, and Examples
- Price–earnings ratio - Wikipedia
- What is price-to-earnings (PE) ratio? | Fidelity
- P/E Ratio (Price-Earnings) | Formula + Calculator
Recommended
- Make Money Online — Ebooks on Passive Income, Stocks & Crypto | Profitomics
- Stock Market Mastery — Swing trading and long-term compounding strategies | Profitomics
- Crypto Profit System — A risk-first framework for building consistent crypto returns | Profitomics
- The Passive Income Blueprint — Build income streams that pay you while you sleep | Profitomics