Risk First Stop Loss Strategies for Traders to Test in 50 Trades
The best stop loss strategy places your exit at the point where your trade thesis is proven wrong, not at some arbitrary distance from your entry. Stop-market orders work for liquid stocks; stop-limit orders suit thinner names. None of it matters without journaling at least 50 trades to confirm the method fits how you actually trade.
TL;DR:
- Using ATR-based stops combined with structural levels generally outperforms fixed percentage stops because it aligns with the stock’s natural volatility.
- Proper position sizing based on risk percentage and stop distance ensures a trader’s maximum loss per trade stays within manageable limits.
- Traders should test stop-loss methods on at least 50 trades to accurately evaluate their effectiveness and fit for their trading style.
- Avoid adjusting stops mid-trade or ignoring how liquidity and gaps affect execution, as these errors significantly increase risk.
- Relying on a consistent, tested stop placement method and journaling results helps develop discipline and improves long-term trading performance.
Table of Contents
- What Are Stop Loss Strategies and Why Order Type Matters
- Five Stop-Placement Methods Every Trader Should Know
- Position Sizing: The Math That Turns a Stop Into a Risk Cap
- Slippage, Gaps, and Stop Hunts: What Really Happens at Execution
- Building and Testing Your Stop-Loss System
- Common Stop Loss Mistakes and How to Fix Them
- Turning These Rules Into a Repeatable Habit
- Discipline Over Perfection
- Build Your Trading System With Profitomics
- Sources
- FAQ
What Are Stop Loss Strategies and Why Order Type Matters
Every stop order eventually does one of three things: it fills instantly at the market price, it fills at a worse price than you expected, or it doesn’t fill at all. Which one happens depends entirely on the order type you picked, and most traders never think about this until they’ve already lost money to it.
A stop-market order triggers at your chosen price and then converts into a market order, filling at whatever price is available next. On a liquid stock like Apple or Microsoft, that fill usually lands within a few cents of your trigger. Investopedia’s breakdown of stop-loss mechanics walks through exactly this scenario: the order guarantees execution, not price.
A stop-limit order adds a second price, a floor below which you won’t accept a fill. Say you own shares at $150 and set a stop-limit at $145 with a limit of $144. If the stock gaps straight through both prices overnight, opening at $138, your order never fills. You’re still holding the position, now down far more than you planned. That’s the trade-off: stop-limit orders protect you from catastrophic slippage but can leave you exposed exactly when you need protection most.
Trailing stops move with the price. You can set trailing stops as a fixed percentage or, more precisely, as a multiple of average true range, which adjusts automatically as volatility shifts.
Bracket orders (sometimes called OCO, or “one cancels the other”) let you set a profit target and a stop loss simultaneously. When one leg fills, the other cancels automatically. This is how most disciplined swing traders operate. They set the exit plan the moment they enter, rather than deciding under pressure while the position is bleeding.
Here’s how to think about picking between them:
- Use stop-market orders for large-cap, high-volume stocks and ETFs where the bid-ask spread is a penny or two.
- Use stop-limit orders for small-cap or thinly traded names where a stop-market order could execute far below your intended exit.
- Use trailing stops on trending positions you want to ride as long as possible without babysitting the chart.
- Use bracket orders whenever you want the exit plan locked in at entry, which is nearly always the right call.
- Avoid stop-limit orders on any position you’re holding through earnings or other binary catalysts, since gap risk is highest exactly then.
The order type you choose is a mechanical decision, but it interacts directly with the stop placement method you use, which is where the real strategy work happens.
Five Stop-Placement Methods Every Trader Should Know
Placement is where most retail traders go wrong, usually because they default to round numbers or gut feel instead of a repeatable method. Five approaches cover almost every situation you’ll encounter, and TradeZella’s rundown of stop loss methods treats these five as the core toolkit professional traders rotate between depending on setup and timeframe.
1. Percentage stops. It’s simple and fast to calculate, which is exactly why it’s popular with beginners. The problem is that a flat percentage ignores how much a stock actually moves.
2. ATR-based stops. This fixes the blind spot in percentage stops by anchoring your distance to the stock’s actual volatility. The formula is straightforward: multiply the 14-period average true range by a factor, typically between 1.0 and 2.0, and subtract that from your entry price. Curved Trading’s guide to setting effective stops recommends matching the ATR period to your trading timeframe, using a daily ATR for swing trades and an hourly ATR for day trades.
3. Structure-based stops. You place the stop just below a swing low, a support level, or a moving average the stock has respected. This ties your exit directly to the reason you entered the trade in the first place. If the stock breaks that structural level, your original thesis is wrong, and you should be out regardless of the dollar amount. The best version of this method combines structure with an ATR buffer, placing the stop slightly beyond the swing low by 0.1 to 0.3 ATR so normal wick noise doesn’t shake you out a level that’s still technically holding.
4. Time-based stops. These exit a trade if it hasn’t moved in your favor within a set window, regardless of price. Momentum traders use this heavily: if a breakout hasn’t followed through within a few candles or a few days, the setup has failed even if price hasn’t hit a traditional stop level yet. Capital tied up in a dead trade is capital that isn’t working elsewhere.
5. Trailing stops. Once a trade moves in your favor, a trailing stop protects profit while leaving room for further gains. You can trail by a fixed percentage, a fixed dollar amount, or an ATR multiple that widens automatically during volatile stretches and tightens during calm ones.
Matching the method to the trade matters more than picking a single “best” one:
- Day traders leaning on tight intraday setups usually do best with ATR-based stops calculated on a short timeframe, since percentage stops are too crude for minute-to-minute moves.
- Swing traders holding for days to weeks often combine structure-based stops with a small ATR buffer, which respects the chart while filtering out noise.
- Position traders holding for months lean on wider ATR multiples or trailing stops, since the goal is riding a trend rather than reacting to daily wiggle.
- Momentum and breakout traders benefit most from time-based stops layered on top of a price stop, since a stalling breakout is often the earliest warning sign.
- Crypto traders, given the asset class’s volatility, typically need wider ATR multiples (closer to 2.0x than 1.0x) than equity traders use for comparable setups.
Pro Tip: Calculate your ATR-based stop distance before you look at the chart’s obvious support levels. If the two numbers land close together, you’ve found a high-conviction stop. If they’re far apart, trust the structural level and treat the ATR distance as a sanity check, not the final answer.
A combined structural and ATR approach tends to outperform a blind percentage stop because it ties your exit to the actual trade thesis while still adjusting for how much the stock naturally moves. That’s not a minor edge. It’s the difference between getting stopped out because you were wrong and getting stopped out because the stock had a normal Tuesday.
Position Sizing: The Math That Turns a Stop Into a Risk Cap
Your stop loss only controls your risk if your position size is calculated from it, not the other way around. This is the single most common mistake among retail traders: they decide how many shares they want to buy first, based on gut feel or available capital, and only then figure out where to put the stop. That sequence has the risk math backward.
The correct formula is simple:
Shares = (Account size × Risk %) ÷ (Entry price − Stop price)
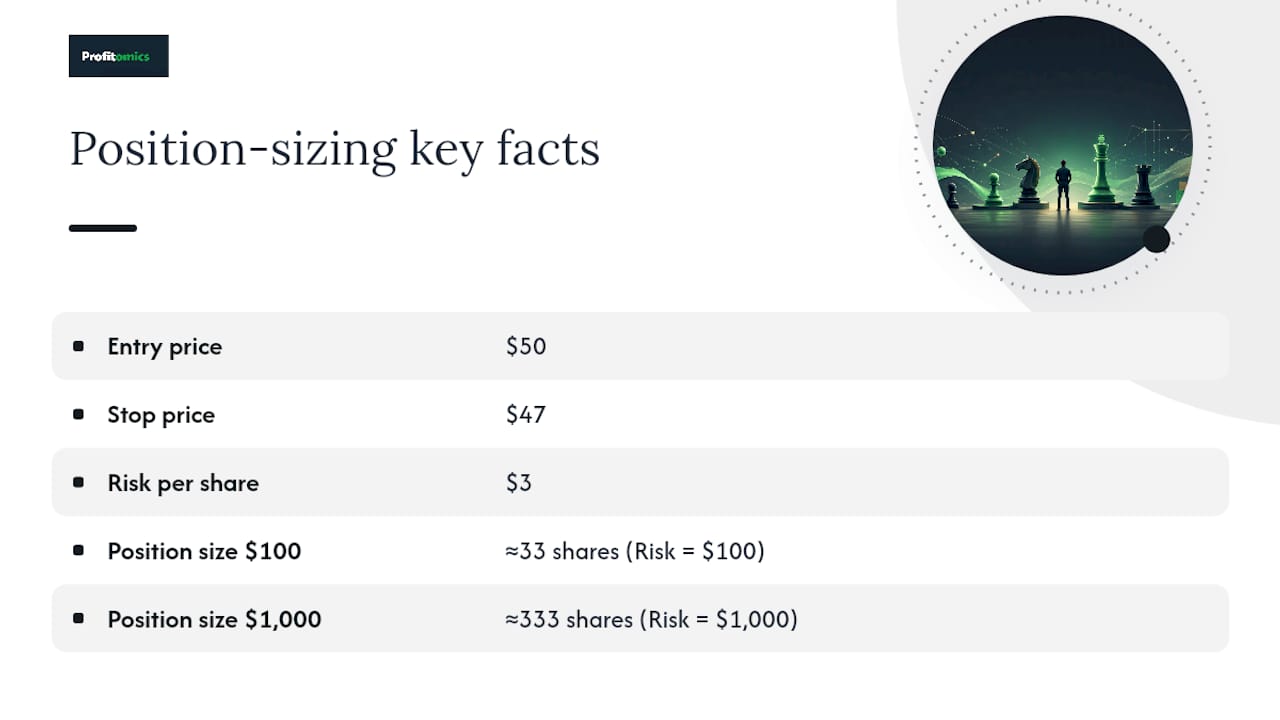
You want to buy a stock at $50, and your ATR-based stop sits at $47, a $3 risk per share. Divide $100 by $3, and you get roughly 33 shares. That’s your position size, full stop. Not “how many shares can I afford,” but “how many shares keep my loss at exactly $100 if I’m wrong.”
Same stock, same $3 stop distance. You get roughly 333 shares. The percentage risked stays identical; only the dollar amount and share count scale with account size.
The 1% versus 2% debate isn’t really about which number is “right.” CME Group’s explanation of the 2% rule frames it as a guardrail rather than a fixed law: 2% gives you more room to size into high-conviction setups but shortens your runway during a losing streak, since five straight 2% losses erode 10% of your account.
You can use a basic percentage calculator to speed up this math while you’re still building the habit, though most trading platforms will calculate share count automatically once you enter your risk percentage and stop price.
Slippage, Gaps, and Stop Hunts: What Really Happens at Execution
A stop order on paper and a stop order in a live, moving market are two different things. Understanding the gap between them is what separates traders who get blind sided from those who plan around it.
Slippage is the difference between your stop price and your actual fill price. On a liquid large-cap stock during regular trading hours, slippage on a stop-market order is usually a few cents, sometimes nothing at all. During a fast-moving sell-off or on a lower-volume stock, that gap widens fast. Understanding how liquidity and spreads affect execution matters most on thinly traded names, where a wide bid-ask spread means your stop-market order might fill several percent below your trigger.
Gap risk shows up overnight. A stock closes at $50, you have a stop at $47, and it opens the next morning at $42 after bad news. Your stop-market order fills near $42, not $47. There is no order type on earth that fully protects you from this. The only real defenses are position sizing small enough to survive a gap, and avoiding holding volatile positions through known catalysts like earnings.
Stop hunting and round-number clustering are real, documented phenomena. Curved Trading’s guide recommends placing your stop 0.1 to 0.3 ATR beyond the obvious round number or swing low rather than right on it, which filters out exactly the kind of shallow wick that hunts easy stops without meaningfully widening your risk.
A few execution habits reduce these risks without complicating your process:
- Default to stop-market orders on liquid large-caps and major ETFs, where fill quality is reliable.
- Switch to stop-limit orders on illiquid small-caps, accepting the non-fill risk in exchange for price protection.
- Check whether your broker holds trailing stops server-side; some platforms cancel trailing stops when your trading software disconnects, which defeats the purpose entirely.
- Confirm your platform’s after-hours order rules before holding through an earnings date or other overnight catalyst.
- Add a small ATR buffer past any round-number stop level rather than placing it exactly on the level.
None of this eliminates risk. It just makes the risk predictable, which is the entire point of having a stop in the first place.
Building and Testing Your Stop-Loss System
A stop method you haven’t tested is just a guess with extra steps. Before you trust any of the placement methods above with real money, you need a process for validating it, and that process starts with a pre-trade checklist you fill out the same way every single time.
Your checklist should force you to answer five questions before you enter any position:
- What is the trade thesis, in one sentence, that justifies this entry right now?
- What price or condition would prove that thesis wrong, meaning your invalidation point?
- Where exactly does the stop go, and which method (percentage, ATR, structure, time, or trailing) determined it?
- What position size does that stop distance allow under your risk cap, whether 1% or 2%?
- What is your maximum account risk if this trade and two or three others like it all lose simultaneously?
Once you’re in the trade, a journal turns individual outcomes into a pattern you can actually learn from. Track the entry price, stop price, exit price, position size, which stop method you used, and the outcome in R-multiples (how many times your initial risk you made or lost). Over time, calculate your win rate, your average win-to-loss ratio, and your expectancy, which tells you whether the system is profitable overall even if individual trades lose.
TradeZella’s guidance on testing stop methods recommends a minimum sample of about 50 trades before drawing conclusions about whether a stop method fits your trading style. Fewer than that, and you’re reacting to noise, not signal. Paper trading is the lowest-risk way to build that sample; a practical paper trading plan lets you run the full 50-trade test without risking a dollar while you dial in placement.
Pro Tip: Tag every journal entry by which stop method you used. After 50 trades, sort by tag. You’ll often find one method dramatically outperforms the others for your specific trading style, and that comparison is impossible to see without the data broken out.
If after 50 trades your expectancy is negative, don’t just tighten the stop. Revisit the entry criteria first. A bad stop can’t fix a bad entry.
Common Stop Loss Mistakes and How to Fix Them
Most stop loss failures aren’t about the placement math. They’re about what happens after the stop is set, when emotion and impatience take over.
- Moving the stop further away mid-trade. This is the single most account-destroying habit in retail trading. If the trade moves against you and you widen the stop instead of accepting the loss, you’ve turned a defined-risk trade into an undefined one. The fix isn’t willpower, it’s mechanics: use a bracket order that locks in the stop at entry so there’s no live decision to second-guess.
- Setting stops too tight for the asset’s actual volatility. A 2% stop on a stock with a 4% average daily range guarantees you get shaken out by normal movement. Check the ATR before setting the stop, not after you’ve already been stopped out three times in a row.
- Ignoring how your broker actually executes stops. Round-number clustering and thin after-hours liquidity aren’t theoretical risks, they show up in real fills. Add the ATR buffer discussed earlier rather than placing stops exactly on obvious levels.
- Treating every stop-out as a signal to abandon the strategy. Some losses are the system working as designed. If your win rate and expectancy over 50 trades are healthy, one string of stop-outs is variance, not failure.
- Skipping the trade entirely when the stop distance doesn’t fit your risk cap. If the only stop level that makes sense is so far from entry that your position size would be too small to matter, that’s useful information. Walk away rather than forcing a smaller, safer stop that no longer reflects the real invalidation point.
The instinct to override a stop almost always comes from treating the loss as personal rather than as the cost of doing business. Widening a stop rarely saves a good trade. It just delays and enlarges a bad one.
Turning These Rules Into a Repeatable Habit
Reading about stop placement and actually applying it consistently, trade after trade, are two very different skills. Worksheets can be designed to close that gap, giving structure so the discipline doesn’t depend on willpower alone.
A stop worksheet walks you through entry price, chosen placement method, calculated stop distance, and the position size that risk distance allows, all filled in before you click buy. A position-size calculator handles the share-count math from the section above automatically, so you’re never eyeballing it under time pressure. Trade-journal tabs track each closed position by stop method, R-multiple, and outcome, giving you the sorted data needed to see which approach actually fits your trading style after 50 trades.
Fill out the worksheet on paper trades first. Run it through a handful of setups where nothing real is on the line, confirm the numbers make sense, and only then move to live capital. The templates don’t replace the thinking in this guide. They just make sure you do that thinking every time, not just when you remember to.
Discipline Over Perfection
The perfect stop placement doesn’t exist. What exists is a method you understand well enough to follow without hesitation when the trade turns against you, and that’s worth more than any formula tweak. Traders chase the ideal ATR multiple for months while ignoring that they moved their last three stops out of fear. Journaling and consistency compound. Precision without follow-through doesn’t.
— Kai
Build Your Trading System With Profitomics
Everything in this guide works better with the right tools in hand instead of scattered across spreadsheets you built at midnight. Certain ebooks package rules-first templates, position-size calculators, and trade-journal frameworks designed to help readers develop a trusted stop-loss system without excessive trial-and-error.
Stock Market Mastery walks through swing trading and position-sizing systems in the same risk-first framework covered here, with the templates already built so you’re filling in numbers, not building spreadsheets from scratch. If crypto is more your speed, the Crypto Profit System applies the same stop-and-size logic to a market where volatility runs even wider than equities. Ebooks are typically delivered instantly as PDF files, allowing users to begin applying concepts promptly. Start with Stock Market Mastery and put a real stop-loss system to work before your next trade.
This article is general information, not a substitute for advice from a qualified financial advisor. Consult a qualified financial professional about your own circumstances before acting on anything here.
Sources
- Stop-Loss Orders: Protect Your Investments From Losses — Investopedia
- How to Set Stop Losses That Actually Work — Curved Trading
- Stop Loss Strategies: 5 Methods That Protect Capital (2026) — TradeZella
- The 2% Rule — CME Group
FAQ
What is the best practice for a stop loss?
Place the stop where your trade thesis is proven wrong, either at a structural level like a swing low or at a multiple of ATR, then size your position from that stop distance rather than picking the distance to fit a share count you already wanted.
What is the golden rule for stop loss placement?
The closest thing to a golden rule is sizing your position from your stop distance, not the reverse, and never moving a stop further away from entry once the trade is live.
How many trades should I test a stop-loss method on before trusting it?
A minimum of about 50 trades, tagged by which stop method you used, gives you enough sample size to judge win rate and expectancy rather than reacting to a short streak of luck in either direction.