5 Minutes a Day: Trading Journal Template You’ll Actually Use

Start with a spreadsheet, not an app. A basic Excel or Google Sheets trading journal template gives you full control over fields and forces you to look at every trade you enter, which builds the habit automation can’t. Pair it with a printable quick-sheet for pre-market checks and Profitomics’ downloadable starter template, linked at the end of this piece, and you have everything needed to begin tonight.
TL;DR:
- Using a spreadsheet trading journal allows full customization, with key fields like date, instrument, entry, exit, size, and R-based result for consistent analysis.
- Daily and weekly reviews should be scheduled regularly to track win rates, identify recurring mistakes, and apply hard rules to improve trading discipline.
- Incorporating qualitative notes, such as setup reasoning and emotional tags, enhances insight and helps refine strategies over time.
- Automated tools save time but require manual checks to detect errors, while traditional paper logs promote deliberate reflection and deeper thinking.
- The Profitomics starter template aligns with the recommended fields and routines, offering a practical, easy-to-import solution for traders at any experience level.
Table of Contents
- Which Trading Journal Template Format Fits Your Style?
- What Fields Belong in a Trading Journal Template?
- How Should You Actually Use the Template?
- What Do Experienced Traders Do Differently?
- Why a Boring Routine Beats a Fancy Template
- Get the Profitomics Starter Template and Checklist
- Where to Find More Templates
- Sources
- FAQ
Which Trading Journal Template Format Fits Your Style?
The format matters less than whether you’ll actually open it every day, but some formats survive daily use better than others depending on how you trade.
A trading journal excel template or Google Sheets version works for most traders because it’s free, customizable, and easy to share with a mentor or trading group. Stockbrokers recommends building your own in Excel using a free spreadsheet template rather than paying for software right away, and that advice holds especially well for anyone still figuring out which metrics matter to their strategy. Set up two tabs from day one: a raw trade log and a summary dashboard that pulls from it automatically.
Notion or a similar docs tool suits traders who lean on screenshots, chart annotations, and long-form thesis notes rather than pure numbers. Notion’s own template library hosts several trading journal formats built exactly for this, letting you embed a chart image right next to your reasoning.
Dedicated journal apps add automation:
- Auto-import from your broker, so trades log themselves
- Built-in analytics like equity curves and R-multiple breakdowns
- The trade-off: monthly fees and, sometimes, awkward data lock-in if you switch platforms
Free tools like TradeBench sit in between, offering planning, position sizing, and reporting without a subscription. Paper and PDF journals still have a following among veteran traders who do their real thinking with a pen at night, away from a screen.
Quick matchups:
- Day traders with high volume — a dedicated app or TradeBench for the auto-import
- Swing traders — Excel or Google Sheets, since fewer trades per week make manual entry manageable
- New traders learning the ropes — paper or PDF for evening reflection, paired with a simple sheet for numbers
What Fields Belong in a Trading Journal Template?
Every solid trading journal spreadsheet needs the same skeleton, whether you build it yourself or copy one. Miss a field here and your later analysis has holes you can’t backfill.
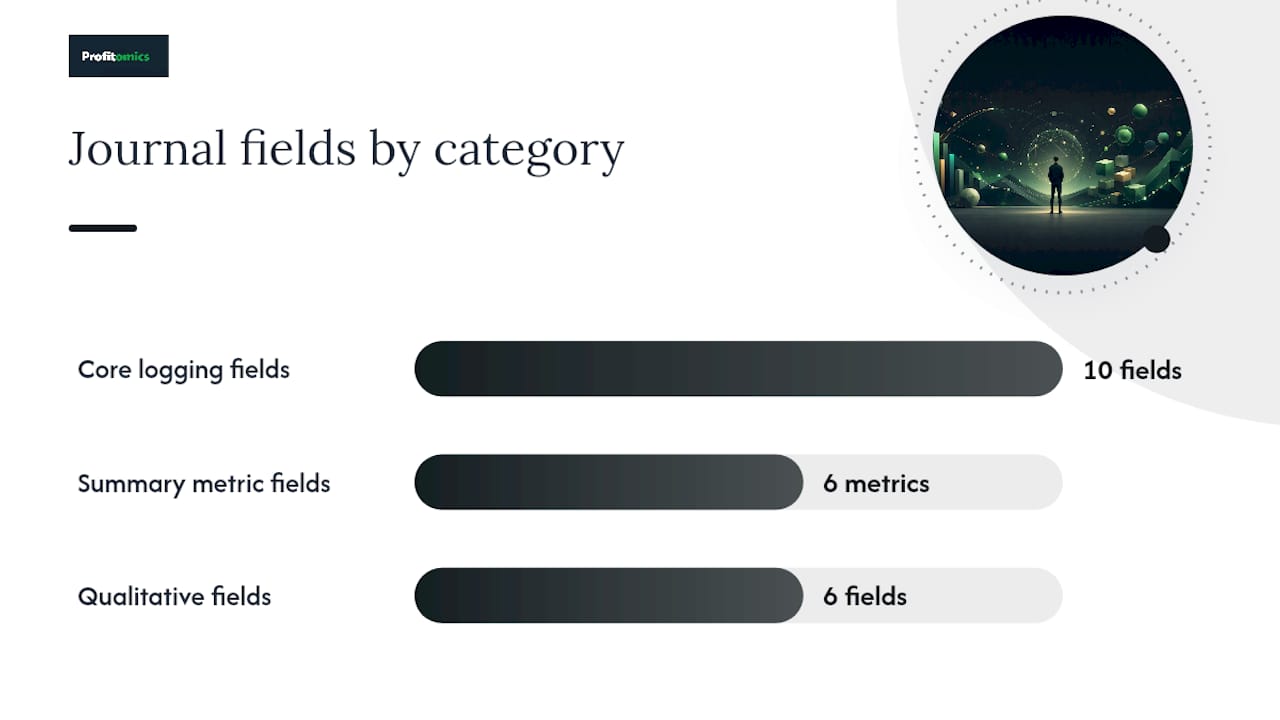
Core logging fields (one row per trade):
- Date and time
- Instrument or market
- Direction (long/short)
- Entry price, stop price, target price, exit price
- Position size
- P&L in dollars
- Result measured in R (your risk unit)
That last field matters more than people realize. TradeOrbit’s free template builds around R-multiples specifically because a $200 loss on a $500 account and a $200 loss on a $50,000 account tell you nothing comparable, but a losing 1R trade always means the same thing: you lost what you planned to risk.
Summary metric fields, usually on a separate dashboard tab:
- Win rate
- Average win and average loss
- Profit factor (gross profits divided by gross losses)
- Expectancy (average R per trade)
- Maximum drawdown
Pro Tip: Build your summary dashboard with formulas that reference the raw log automatically. If you have to manually recalculate your win rate every week, you’ll stop doing it within a month.
Qualitative fields round out the picture: setup name, your pre-trade thesis in one sentence, a yes/no column for “did I follow my rules,” an emotion tag, and a quick note on what you’d do differently. Add a column for a screenshot link or file path so every trade has visual evidence you can revisit.
Standardize outcomes by using R consistently and applying the same fee estimate across trades in the same instrument. Without that, your profit factor and expectancy numbers will drift for reasons that have nothing to do with your trading.
How Should You Actually Use the Template?
A template is only as good as the review habit built around it. Here’s the cadence that turns raw entries into real improvement.
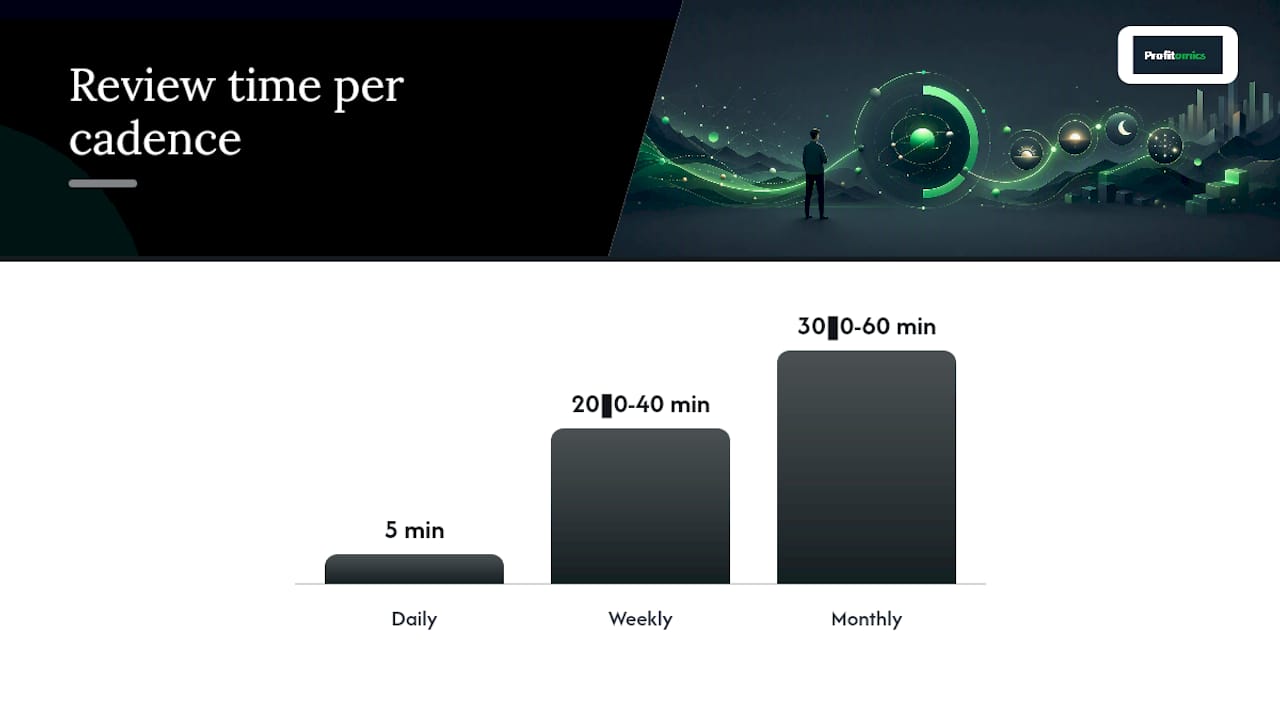
- Daily (about 5 minutes). Run a short pre-session checklist before the market opens, then close the day with a two-sentence note: what happened, and whether you followed your plan.
- Weekly (20 to 40 minutes). Filter your log by setup name and calculate the win rate for each one separately. List the two mistakes that repeated most often. If one setup shows a negative expectancy over your last 10 to 15 trades, flag it for a pause.
- Monthly (30 to 60 minutes). Plot your equity curve, recheck your overall expectancy, and audit position sizing. Update your written playbook with anything you learned.
Build in a hard rule, not just a soft intention. Something like “stop trading Setup B after three consecutive losses” or “if a setup’s expectancy over the last 20 trades falls below zero, retire it until reviewed” turns your journal from a diary into an actual filter.
Pro Tip: Put your weekly review on the calendar like an appointment, same day, same hour. Traders who treat the review as optional skip it the first busy week and never come back.
Time-block these reviews the way you’d block time for anything else you don’t want to skip. Five minutes a day and 20 to 60 minutes weekly and monthly is not a heavy lift, but it’s the difference between a journal that changes your trading and one that just accumulates rows.
What Do Experienced Traders Do Differently?
Practitioner habits worth stealing, once the basic log is running:
- Double-journal. Keep the spreadsheet for metrics and add a short handwritten page each evening for the “why” behind your decisions. Practitioner accounts consistently note that handwriting forces a slower, more deliberate look back at the day than typing does, which is why even automated traders often keep a paper page going.
- Watch what automation hides. Auto-importing broker data saves time and cuts data-entry errors, but if you never touch the raw fills, you can miss a mislabeled trade or a fee that got applied wrong. Build a 30-second manual check into your daily routine even if imports are automated.
- Skip vanity metrics. Win rate alone tells you almost nothing; a 70% win rate with tiny wins and rare huge losses can still lose money. Anchor your review around expectancy and R-multiples instead.
- Track repeat offenses with a dollar figure attached. A repeat-offender tracker that tags recurring mistakes and totals their cost tells you exactly which habit to fix first, and by how much it’s worth fixing.
Why a Boring Routine Beats a Fancy Template
Most traders overthink the format and underthink the routine. A three-column spreadsheet reviewed every week beats a beautifully automated dashboard nobody opens.
That’s the whole philosophy behind how Profitomics builds its downloadable templates: actionable over impressive, five minutes a day over a weekend project you abandon. Pick one format this week. Log every trade for one month before you judge whether it’s working.
— Kai
Get the Profitomics Starter Template and Checklist
Profitomics built its downloadable trading journal template to match the field blueprint above, column for column, so you’re not guessing which fields matter or building formulas from scratch. The download includes a ready-to-use spreadsheet with the trade log and auto-calculating summary dashboard, a printable quick-start checklist for pre-market prep, and short guidance notes tying each field to the review routine covered here.

Import the spreadsheet directly into Google Sheets with one click, or copy the same column structure into Notion if you prefer working with screenshots and longer notes. Either way, the setup mirrors what’s outlined above: raw log, summary tab, weekly filter routine.
If you’re building a full trading system rather than just a log, Stock Market Mastery bundles swing trading strategy with the templates that support it. For your first session with the new journal, do one thing: log your last five trades from memory or your broker history, then run the weekly review checklist once, even with that small sample. Grab the Profitomics template bundle and get that first session done today.
Where to Find More Templates
For a free Excel starting point, StockBrokers.com’s guide covers spreadsheet setup in more depth. Community-built Google Sheets versions circulate on forums like r/Daytrading, useful for seeing how other traders structure their columns. If broker syncing appeals to you, TradeBench has offered a free automated option since 2011.
Sources
- Stockbrokers
- Free Trading Journal & Trade Planning Tools | TradeBench
- Digital vs paper trading journal — Swingfolio blog
FAQ
What Should a Trading Journal Template Include at Minimum?
At minimum, log the date, instrument, direction, entry, stop, target, exit, size, dollar P&L, and result in R, plus a summary dashboard tracking win rate, profit factor, and expectancy.
Is a Trading Journal Excel Template Better Than an App?
Neither is universally better. An Excel or Google Sheets template gives you full customization and costs nothing, while dedicated apps save time through auto-import but usually charge a subscription.
How Often Should I Review My Trading Log?
Review briefly every day (about 5 minutes), do a deeper filtered review weekly (20 to 40 minutes), and run a full equity-curve and expectancy audit monthly (30 to 60 minutes).
Can I Use the Same Trading Journal Template for Stocks and Forex?
Yes, as long as you standardize results in R and apply a consistent fee estimate per instrument, since raw dollar comparisons across different position sizes and markets aren’t meaningful on their own.
Does Profitomics Offer a Free Trading Journal Template?
Profitomics provides a downloadable spreadsheet template with a printable quick-start checklist that maps directly to the field blueprint and review routine described in this guide.