Earn 0.5–2% Monthly With ATR Spaced Grid Trading and Ready Templates
Grid trading places a ladder of buy and sell orders at fixed intervals above and below a set price, profiting from normal price oscillation rather than direction. It works best in range-bound, choppy markets where price bounces between levels instead of running one way. The strategy’s biggest dangers are a sustained trend that fills only one side of the ladder and transaction costs quietly eating the small gains between levels.
TL;DR:
- Range-based grids adjusted to asset volatility tend to perform best in sideways markets and require tight risk controls to avoid major losses.
- Setting proper grid spacing needs calculation with ATR or daily range data, not guesswork, to prevent oversized bets on market direction.
- Backtesting with multiple years of intraday data and demo trading are essential steps before deploying automation, especially to monitor drawdowns and profit factors.
- The biggest risks come from sustained trends filling only one side of the grid, high transaction costs, and funding rates in perpetuals eroding gains.
- Active management involving re-centering, tight stops, and conservative sizing is necessary, as grids require ongoing supervision and adjustment.
Table of Contents
- How Grid Trading Strategy Mechanics Actually Work
- Grid Strategy Types: Range, Trend, and Hedged
- How Do You Set Grid Spacing, Levels, and Position Size?
- Automation and Backtesting: Building a Grid Bot You Can Trust
- Risk Management, Costs, and the Ways Grids Fail
- A Worked Example: Grid Math From Spacing to Net Profit
- What Grid Trading Really Demands From You
- Get the Templates That Make Grid Setup Repeatable
- Sources
- FAQ
How Grid Trading Strategy Mechanics Actually Work
Every grid starts with a base price. From there, you place buy orders at set intervals below it and sell orders at set intervals above it, spacing them evenly across a chosen range. As Investopedia’s definition of grid trading explains, the strategy captures oscillation without ever forecasting which way the market will move next.
A single completed cycle looks like this: price drops, fills a buy order, then rebounds and hits the paired sell order one grid step above. The gap between those two fills, minus spread and commission, is your profit on that cycle. Do that dozens of times across a choppy week and the small wins compound.
Two structural choices matter early:
- A symmetric grid places equal buy and sell levels on both sides of the base price, betting on pure mean reversion.
- A skewed grid tilts more orders toward one direction, useful when you expect a mild upward or downward drift inside the range.
Skewing adds directional exposure, so it needs tighter risk controls than a neutral grid.
Grid Strategy Types: Range, Trend, and Hedged
Not every grid is built the same way, and picking the wrong type for the current market is the single most common setup mistake.
- Range-based grids work best when price has established clear support and resistance and keeps bouncing between them. This is the classic version, and Admiral Markets’ breakdown of forex grid trading treats it as the default approach for sideways conditions.
- Trend-following grids bias the ladder in the direction of a developing move, spacing more buy orders below price in an uptrend, for example. This captures pullback profit while still riding the broader trend, but it carries real directional risk if the trend reverses hard.
- Hedged grids run long and short positions simultaneously, common on perpetual futures and CFD platforms that allow it. They smooth out equity swings but add funding costs and margin complexity that a simple spot grid never has to deal with.
Advanced traders sometimes add re-centering, shifting the entire grid’s base price after a structural break, or dynamic spacing that widens and narrows with volatility rather than sitting at a fixed distance. Both techniques from QuantPedia’s primer on grid trading reduce trend risk, but they demand more hands-on management than a static grid.
How Do You Set Grid Spacing, Levels, and Position Size?
Spacing is where most beginners guess instead of calculate, and guessing is how a grid turns into an oversized bet on one side of the market.
- Measure recent volatility. Pull the Average True Range (ATR) or average daily range for your instrument. A common starting rule ties spacing to 0.5 to 2 times ATR, as Admiral Markets notes, so the grid adapts to how the asset actually moves instead of using an arbitrary pip count.
- Set your range and level count. Divide your total intended price range by your spacing distance to get the number of levels. A 200 pip range with 20 pip spacing gives you 10 levels per side.
- Calculate worst-case drawdown. Multiply the number of filled levels by your lot size and by spacing, then apply a safety multiplier, commonly 2 times, before committing capital.
Statistic Callout: Realistic net returns on a well-configured range grid tend to land around 0.5 to 2% per month after fees, with occasional sharp drawdowns if trend risk isn’t contained. That’s the ceiling most traders should plan around, not a guaranteed floor.
Before going live, confirm your broker permits Expert Advisors, offers micro-lots, and keeps spreads tight, since SteadyPips’ setup checklist flags broker constraints as a common reason grids underperform their backtest.
Automation and Backtesting: Building a Grid Bot You Can Trust
Running a grid by hand is possible on a slow-moving market, but most traders automate it because a grid can require dozens of order placements a day. An Expert Advisor (EA) or trading bot removes the execution lag, though it introduces its own failure points if configured carelessly.
Before risking real capital, run a structured backtest:
- Use multiple years of tick data, not just daily closes, since grid fills depend on intraday price movement.
- Track maximum drawdown and profit factor, not just net profit, because a strategy can look profitable on paper while carrying dangerous swings.
- Demo-trade for several weeks under live spreads before funding the account, a step SteadyPips’ backtesting guide treats as non-negotiable.
Check these EA settings specifically: grid gap, lot size per level, maximum open orders, and an equity stop that halts trading if losses hit a preset threshold.
Pro Tip: Run your EA on a VPS rather than a home computer. A dropped internet connection during a fast move can leave half a grid unfilled and your risk exposure lopsided.

Also confirm how your bot handles weekend gaps and slippage. Both can push a fill well past your intended price on the reopen.
Risk Management, Costs, and the Ways Grids Fail
The single biggest threat to any grid is a sustained trend that keeps filling orders on one side without ever triggering the opposite close. Admiral Markets identifies this one-directional risk as the strategy’s core weakness, and it’s why a kill price or equity stop belongs in every configuration, not just the aggressive ones.
Transaction costs matter more than most beginners expect. If your spacing is 15 pips and your round-trip cost is 3 pips, you’re giving up 20% of every cycle’s profit before it even counts. On crypto perpetuals, funding rates add another drag: holding net long or short inventory during a funding period can erase a week of grid gains, a cost that spot grids simply don’t carry, according to LMEX’s grid trading guide.
| Risk factor | Typical impact | Mitigation |
|---|---|---|
| Sustained trend | One-sided fills, growing exposure | Kill price, equity stop, re-centering |
| Spread and commission | Reduces profit per cycle | Widen spacing, choose low-cost broker |
| Funding rate (perpetuals) | Erodes gains on net inventory | Prefer spot, hedge, or shorten hold time |
| Excess leverage | Amplifies drawdown | Cap leverage conservatively, size for worst case |
Pause a grid, or avoid starting one, around major news events, when ADX readings show a strong trend forming, or when liquidity thins out and spreads widen unpredictably.
A Worked Example: Grid Math From Spacing to Net Profit
Say you’re running a range grid on an asset with a daily ATR of $40, trading between $1,900 and $2,100.
- Set spacing at 1x ATR, or $40, giving you five levels on each side of a $2,000 base price.
- Assign 0.1 lots per level. A full one-sided fill (five levels) means 0.5 lots of net exposure.
- Calculate worst-case drawdown: 5 levels x $40 spacing x 0.1 lots, then apply a 2x safety multiplier as SteadyPips’ setup guide recommends, which sets your required buffer well above the raw exposure figure.
- Estimate cycles. In a genuinely range-bound week, this setup might complete 8 to 12 full cycles, each netting roughly $35 after a $5 cost deduction from the $40 spacing.
That’s a modest weekly return, and it evaporates fast if the range breaks.
What Grid Trading Really Demands From You
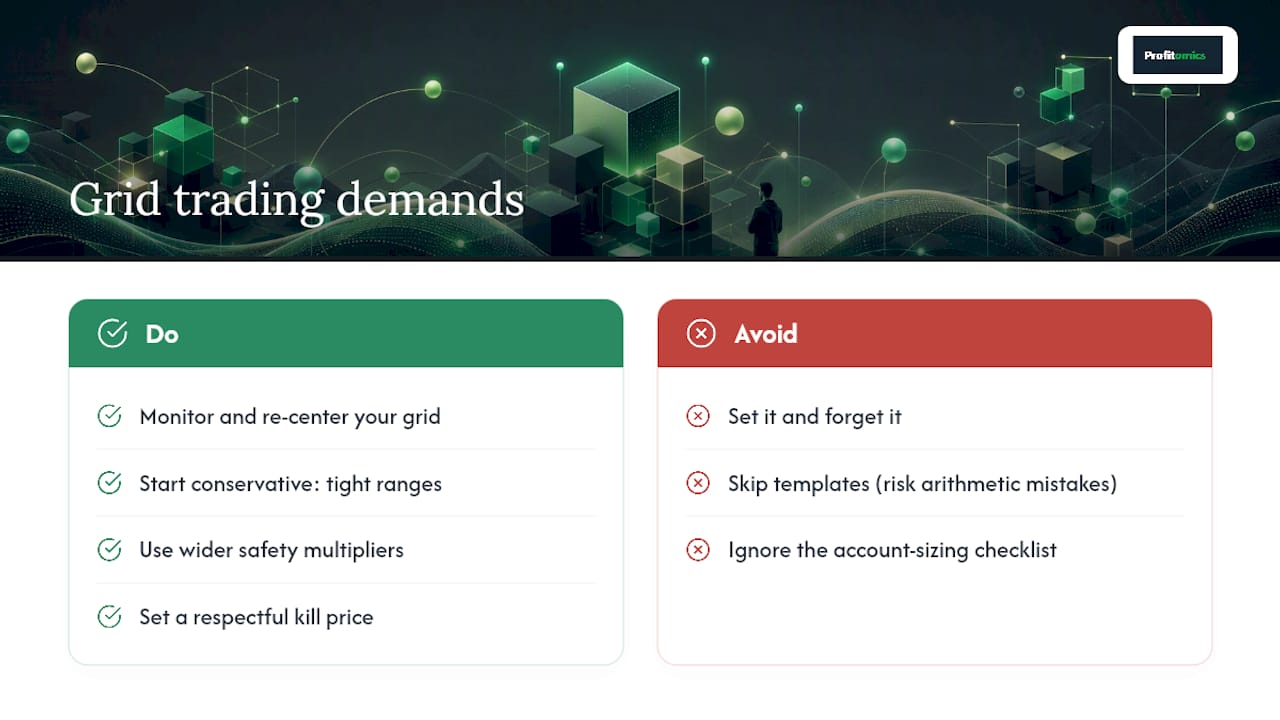
A grid bot doesn’t remove you from the decision chain, it just changes what decisions you make. You’re not picking entries anymore. You’re watching for the moment the range you built the grid around stops being a range, and that judgment call is harder than most marketing around automated trading admits. Practitioner guidance from HaasOnline is blunt about this: grids need active monitoring and re-centering, not a “set it and forget it” mindset.
When I look at grid setups, I start conservative. Tighter ranges, wider safety multipliers, and a kill price I actually respect. Templates exist because most setup mistakes are arithmetic errors, not strategy errors, and a checklist for account sizing catches those before they cost you.
— Kai
Get the Templates That Make Grid Setup Repeatable
Reading about spacing formulas is one thing. Filling in your own numbers without a second-guessing spreadsheet is another. Profitomics builds ebooks around exactly that gap, giving aspiring traders the worksheets and checklists that turn a concept like grid trading into a system you can actually run.

The materials map directly to what this guide covers: a risk management checklist for setting kill prices and equity stops, a backtest template for tracking drawdown and profit factor before you go live, and parameter worksheets so you’re not eyeballing spacing and lot size on a live account. Every ebook ships as an instant PDF with companion templates, so you can move from reading to a working spreadsheet the same afternoon. If crypto markets are your focus, the Crypto Profit System walks through a risk-first framework built for exactly this kind of setup.
Visit Profitomics to see the full library and find the ebook that matches where you’re starting from.
Sources
- Grid Trading Definition - Investopedia
- Grid trading in forex: 3 strategies, examples & bot setup - Admiral Markets
- Forex grid trading strategy: Complete guide + free EA - SteadyPips
- Lmex
- HaasOnline — grid trading bot practitioner guidance
Consult these directly, along with your own broker’s documentation, before running any strategy on a live account.
This article is general information, not a substitute for advice from a qualified financial advisor. Consult a qualified financial professional about your own circumstances before acting on anything here.
FAQ
Is grid trading profitable?
It can be, mainly in sideways markets, but net returns tend to be modest, often in the 0.5 to 2% monthly range after fees, with real drawdown risk if a trend breaks the range.
What is the best strategy for grid trading?
A range-based grid with ATR-adjusted spacing tends to be the most reliable starting point, paired with a hard equity stop to limit losses if the market starts trending instead of ranging.
What is the 5-3-1 rule in trading?
The 5-3-1 rule is a general trading discipline guideline (trade 5 currency pairs, master 3 strategies, trade at 1 preferred time), not a grid-specific formula, and it isn’t a standard parameter in grid trading setup.
Is grid trading illegal?
No. Grid trading is a legal, widely used trading technique, though results depend entirely on execution, broker terms, and risk controls, not the legality of the method itself.